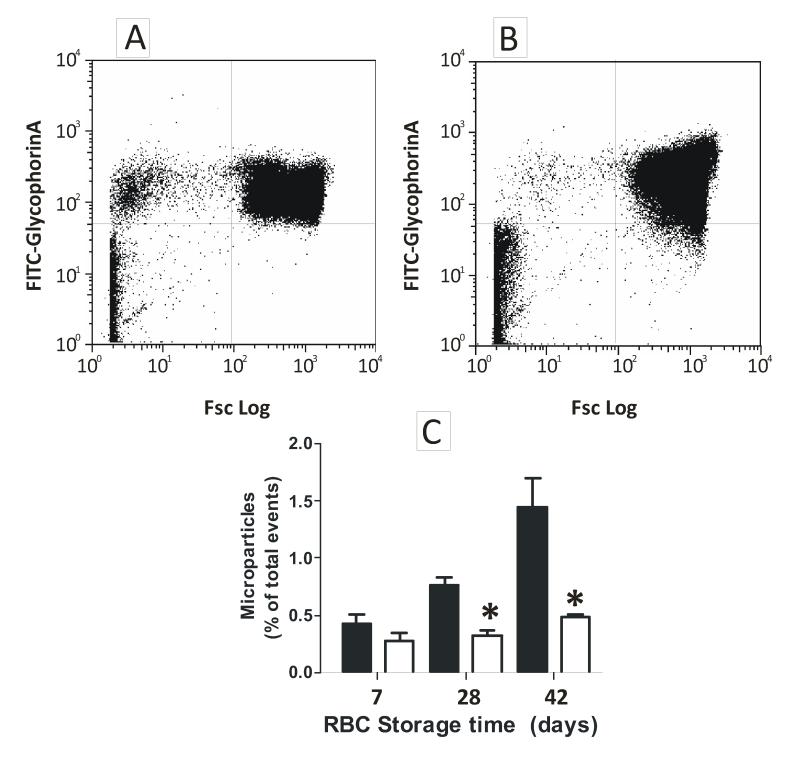
Figure 4. Testing a role for microparticles or cell-free hemoglobin in enhanced stored RBC dependent inhibition of NO-signaling.
Panel A and B show representative histograms for microparticle analysis in 42d RBC by FACS before and after washing respectively. Events in upper left quadrant represent microparticles and upper right quadrant intact RBC. Panel C shows changes in microparticle levels during storage before (■) and after (□) washing. Data are mean ± SEM (n=3). *P<0.02 relative to before washing by t-test.

