
Figure 4.
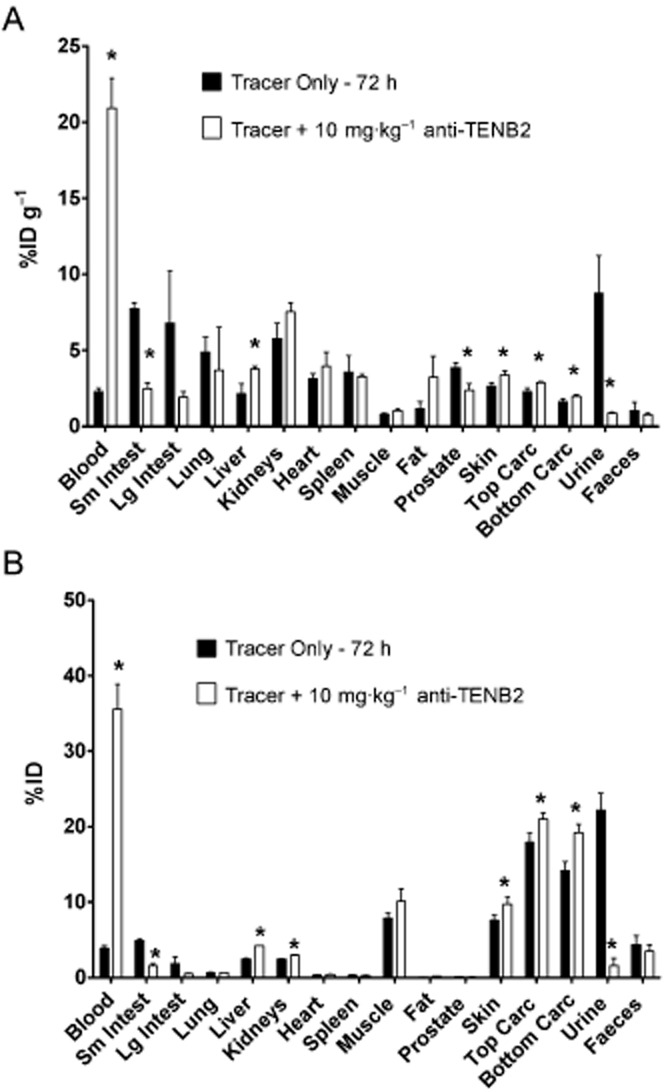
Comprehensive tissue distribution (A) and mass balance analysis (B) of [111In]-anti-TENB2-MMAE (ADC) in non-tumour-bearing SCID mice at 72 h after i.v. injection. The tracer was administered alone or in combination with unconjugated anti-TENB2 (ThioMab) at 10 mg·kg−1. Data are presented as % of injected dose g-1 tissue (A) or % of injected dose (B) as mean ± SD for three mice per group. ‘Carc’ denotes carcass remaining after tissue harvest. Asterisks indicate statistical significance (P < 0.05) by unpaired t-test.