
Fig. 2.
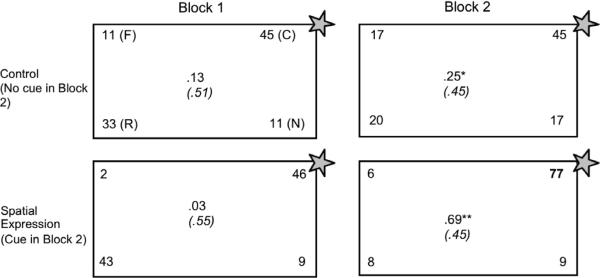
Results from Experiment 1. Starred corner indicates search at the correct corner (C). All data are rotated to the format indicated in the upper left hand box, with numbers indicating mean percent of searches at correct location (C), rotational error (R), near error (N), and far error (F). The numbers in the center of each diagram are mean difference scores (C–R) and standard deviations. Asterisks (*) indicate difference scores significantly above zero (*p < .05, **p < .01). Numbers in bold type indicate significantly more correct search in the experimental group relative to controls.