
Figure 2.
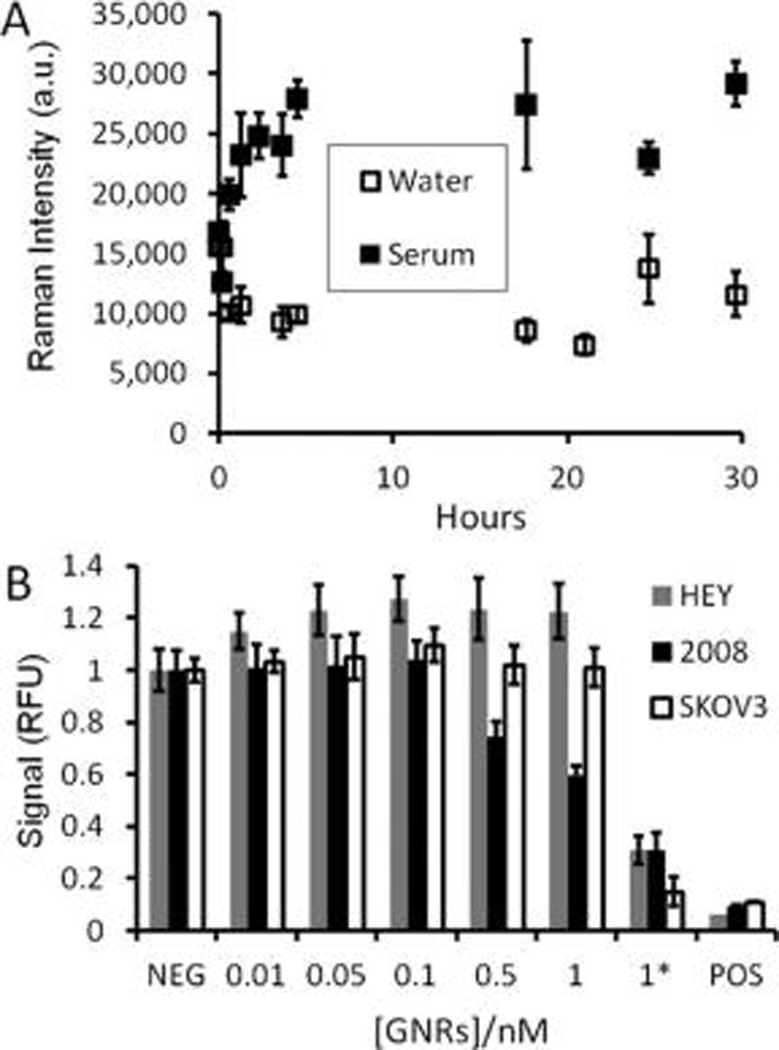
Stability and cellular toxicity of GNRs. (A) GNRs at 0.13 nM were incubated in water or 100% mouse serum at 37 °C; the signal at 1202 cm−1 was plotted as a function of time. The signal in water is constant while the serum samples increase, perhaps due to aggregation in serum proteins creating SERS “hotspots.” This suggests that the adherence of the IR792 Raman dye onto the GNR surface is stable even in biological environments. The error bars in panel A represent the standard deviation of three replicate spectra. (B) Three different OvCA cell lines (10 000 cells per well (n = 6 wells) in a 96 well plate) were treated with increasing concentrations of GNRs as well as GNRs before dialysis and PEGylation (CTAB-coated GNRs; indicated by and asterisk (*)). Cells were then studied with the Presto Blue metabolic assay (reagent previously validated; see Supporting Information, Figure S.6). A positive control (POS) consisted of 0.25 mg/mL CTAB. The 2008 cell line is more sensitive to GNR toxicity than the HEY and SKOV3 lines. All cell lines showed significantly reduced metabolic toxicity in the presence of CTAB-coated GNRs (*). The error bars in B represent the standard deviation of six replicate wells. Data are presented relative to the mean of the six wells not treated with GNRs (NEG).