
Figure 3.
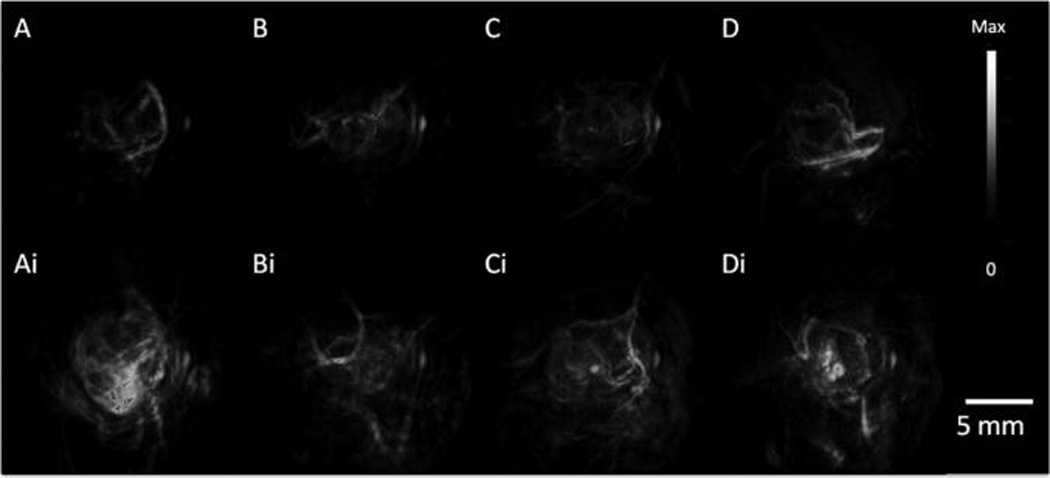
PA Tumor Imaging with GNRs. PA images were constructed with a volumetric rendering via Amide software with global thresholding values before (top) and 6 h post (bottom) tail-vein injection of 200 uL of 5.4 nM GNR (756 nm resonance) contrast. (A) MDA-435S tumors serve as a positive control. Panels B, C, and D, are 2008, HEY, SKOV3 tumors, respectively. Intensity and scale bar to right apply to all images.