
Figure 5.
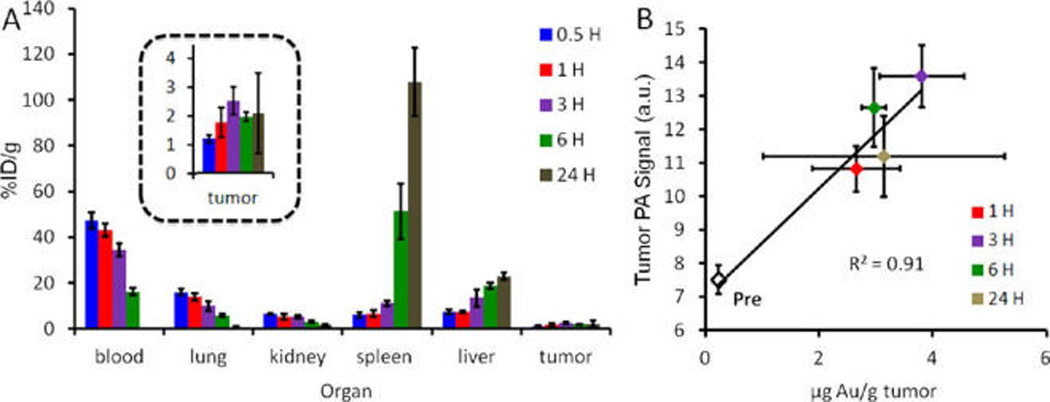
Biodistribution and validation. (A) Time course biodistribution data indicates a blood pool supply greater than 10% ID/g for at least 6 hours after intravenous injection. Major sites of accumulation include the spleen and the liver, typical of RES uptake. Tumor accumulation peaks at 3 h at 3.8±1.0%ID/g. (B) Importantly, there is a positive linear relationship between the concentration of gold in the tumor and PA signal. Both the PA signal and gold concentration peak at 3 h postinjection. In panel A error bars represent the standard deviation of three animals; error bars in panel B are the standard error.