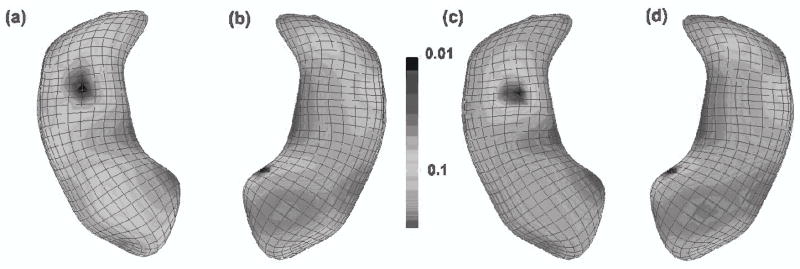
Figure 3.

Significance testing at the atoms of the m-rep models of the Hippocampus structures: Color-coded maps of p—values and adjusted p—values for LRaET. (a) and (c): left hippocampus; (b) and (d): right hippocampus, (a) and (b): raw p—values of LRaET based on a χ2 distribution, (c) and (d): adjusted p—values of LRaET based on false discovery rate procedure for the correction of multiple comparisons. After correction for multiple comparisons, statistically significant group effects remain in the body of both the right (d) and left (c) hippocampus structures. We present the − log10(p) values of all atoms on the smoothed left and right hippocampus surfaces.
