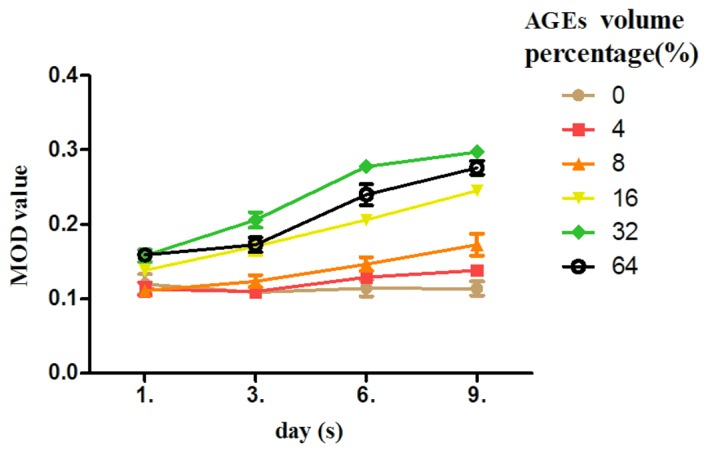
Figure 5.

Effect of AGEs on the production of bFGF by Müller cells. Müller cells were treated with 0, 8, 16, 32 and 64% volume percentages of AGEs. The culture period after the addition of AGEs is indicated on the abscissa and the MOD values are indicated on the ordinate.
