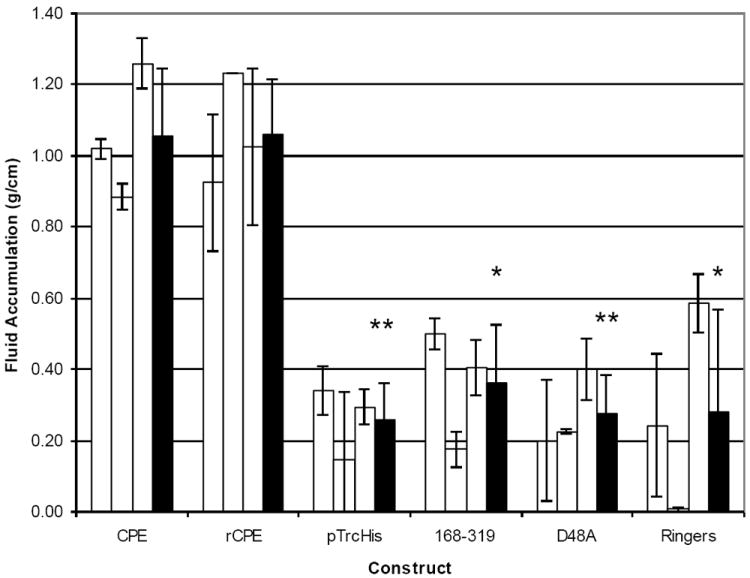
Figure 2.

Fluid accumulation in rabbit small intestinal loops inoculated with 300 μg of CPE, rCPE, two non-cytotoxic CPE variants (168-319 and D48A) or two different buffers (negative controls) and thenincubated for 6 h while rabbits were under anesthesia. At the conclusion of the experiment, loop fluid content was measured and the amount of accumulated fluid was related inversely to the length of each loop (g/cm). White bars for each inoculum preparation represent the average of duplicate ileal loop samples in a single rabbit, while black bars represent the combined average results for three rabbits. Error bars represent the standard deviation from the mean. Statistical significance of <0.005 between a construct and rCPE is indicated with a ‘**’, whereas ‘*’ similarly indicates statistical significance of <0.05. Copyright © American Society for Microbiology, Infection and Immunity, 76, 2008, 3793-3800, DOI: 10.1128/IAI.00460-08. Used with permission.
