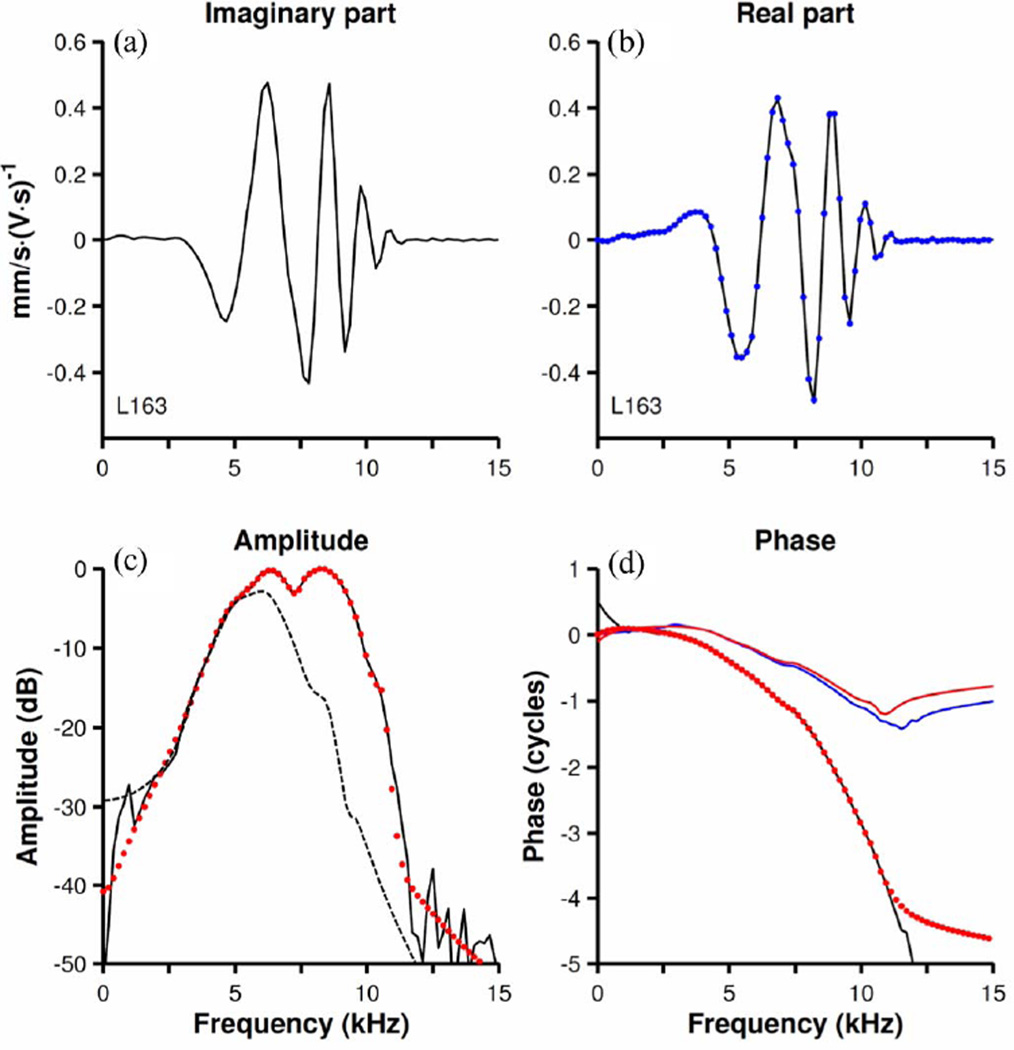
Fig. 4.
Hilbert-transform analysis of first-order Wiener kernels: tests of causality and minimum-phase behavior. The imaginary and real parts of the Fourier transform of a first-order kernel are shown in (a) and (b), respectively. Blue dots in (b) indicate the real part of the Fourier transform computed from the imaginary part using the Hilbert function in MATLAB. Black continuous lines in (c) and (d) indicate the amplitudes and phases, respectively, computed from the functions (black lines) of (a) and (b). Red dots in (c) and (d) represents the amplitude and phase functions, respectively, of a nonminimum-phase ARMA (14,14) model fitted to the time-domain kernel. Red and blue continuous lines in (d) indicate the phases of the minimum-phase version of the ARMA filter and those computed with a Hilbert transform. Dashed black line in (c) shows the magnitude spectrum of an auxiliary minimum-phase filter. The ARMA filter was divided by the auxiliary filter in advance of the computation of phases [blue line in (d)] by Hilbert transformation (10). CF = 9.7 kHz.

