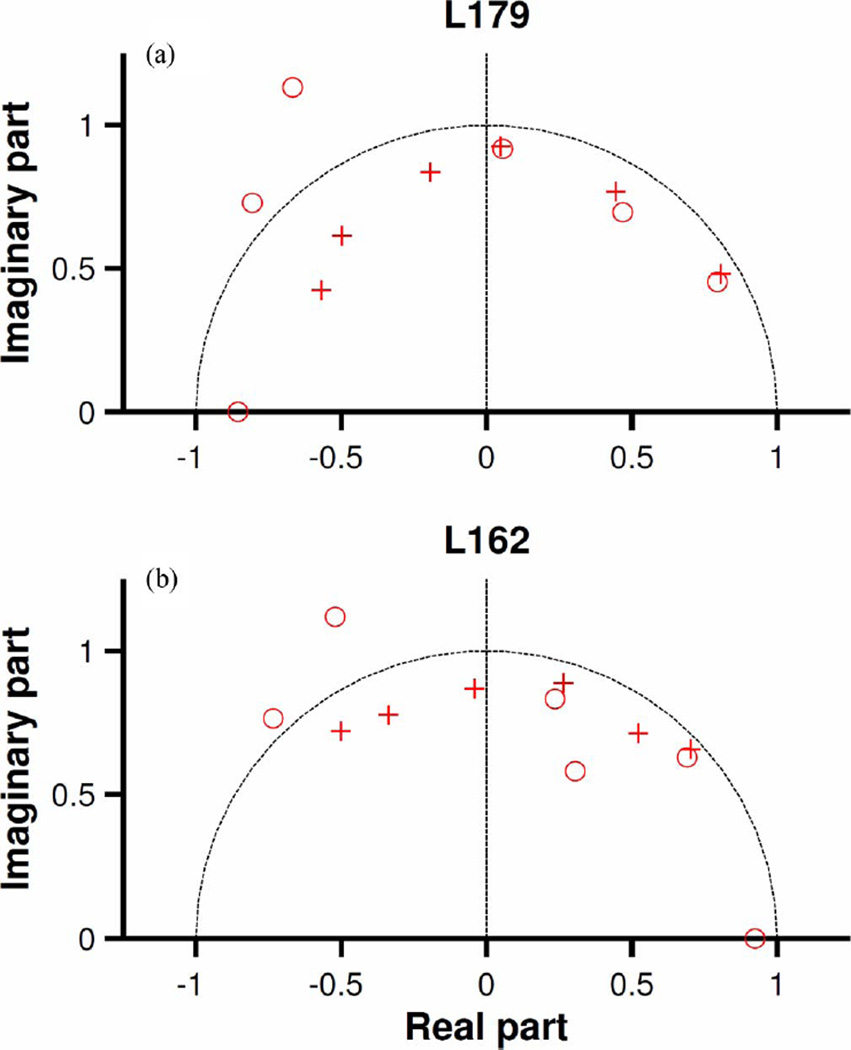
Fig. 7.
Zero-pole diagrams of the discrete non-minimum-phase filters of Fig. 6. Zeroes and poles are indicated by circles (o) and crosses (+), respectively. Zeroes that are located very far from the unit circle (dashed lines) are not shown. Sampling frequency = 25 kHz.

