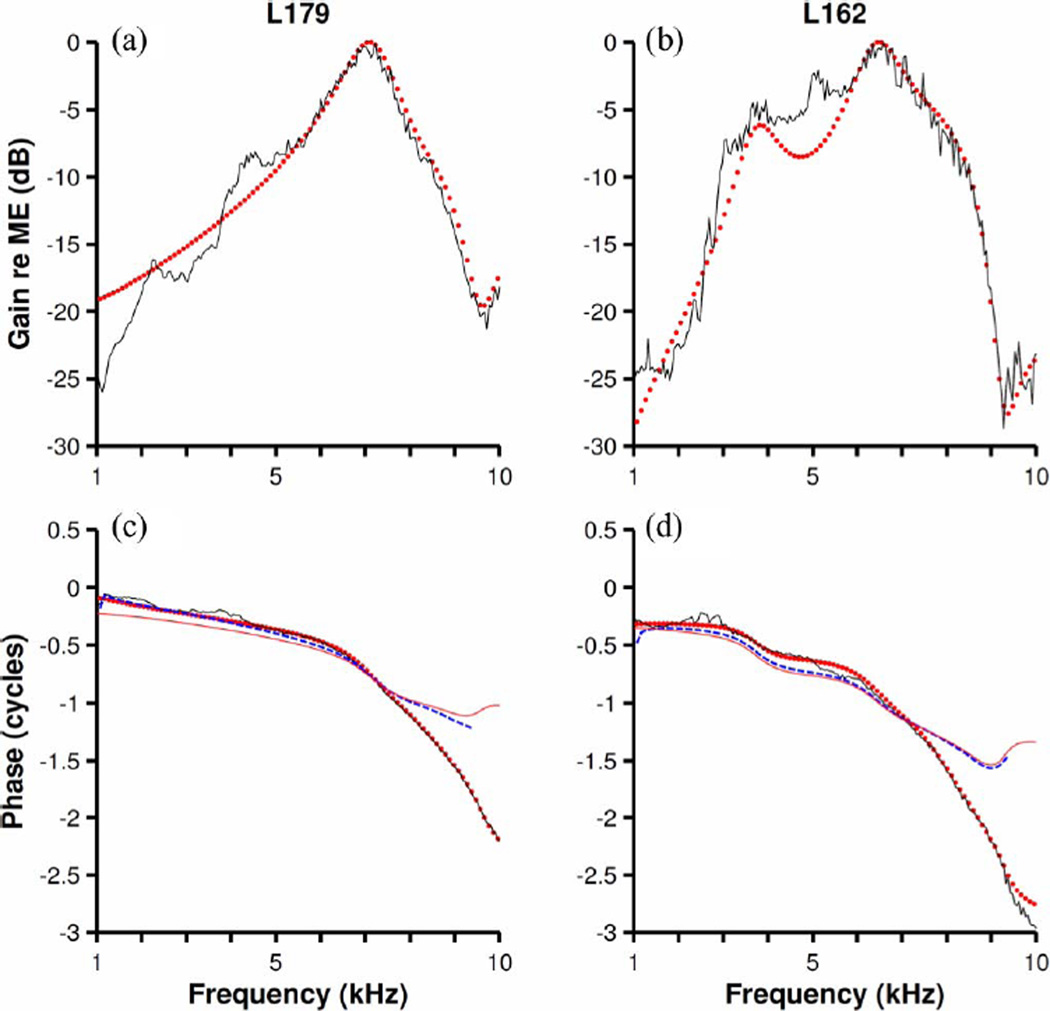
Fig. 8.
Simplification of nonminimum-phase models by reduction in the numbers of poles and zeroes. Continuous black traces represent the amplitude and phase functions of Wiener kernels also shown in Fig. 6. Red dots indicate amplitude or phase functions of ARMA models with reduced number of poles and zeros [three pairs for (a) and (c); four pairs for (b) and (d)]. Blue-dash traces in (c) and (d) represent (minimum) phases computed from their corresponding amplitude function using (9) plus a 75-µs delay. Integration limits were 1 and 9.5 kHz. Red continuous lines in (b) and (d) represent minimum phases derived from the nonminimum-phase ARMA model by reflecting zeroes outside the unit circle. L179 CF = 9 kHz. L162 CF = 9 kHz.

