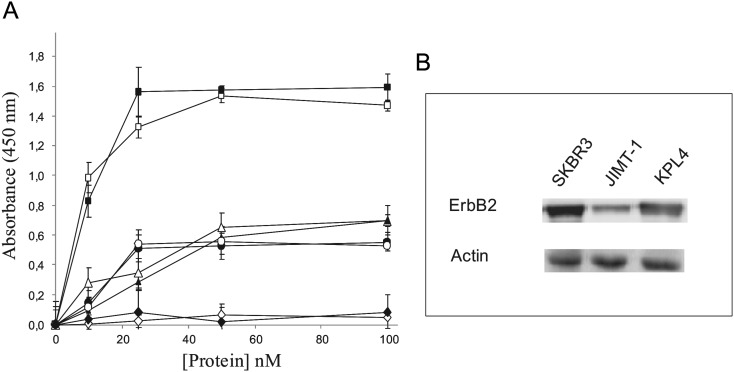
Fig. 4.
(A) Binding curves of ERB–HP-RNase (empty symbols) or ERB–HP-DDADD-RNase (black symbols) to ErbB2-positive SKBR3 (squares), KPL4 (circles), JIMT1(triangles) or ErbB2-negative A431 (rhomboids) cell lines. (B) Quantitative analysis by western blotting of the ErbB2 receptor levels on the indicated cells. The intensity of positive bands was measured by a phosphorimager and normalized to the levels of actin, used as a standard protein.

