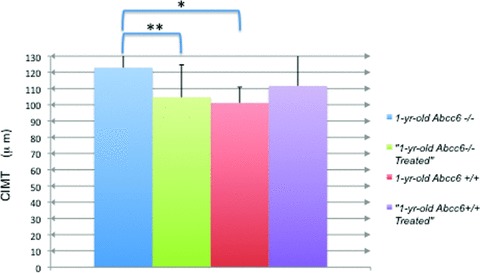
Figure 3.

CIMT in 1‐year‐old wild‐type and treated versus knockout and treated mice. Using 40 × magnifi cation and Image‐Pro Plus software, measurements of intima to media were taken after calibration and averaged for each panel. The averages, with standard deviation, of the five untreated knockout mice (blue), six treated knockout mice (green), five untreated wild‐type mice (red), and eight treated wild‐type mice (purple) were calculated. The difference between untreated wild‐type and knockout CIMT is statistically signifi cant, p value = 0.009*. There is a statistically signifi cant difference between the untreated versus treated knockout groups (p = 0.02)** but not between the untreated versus treated wild‐type.
