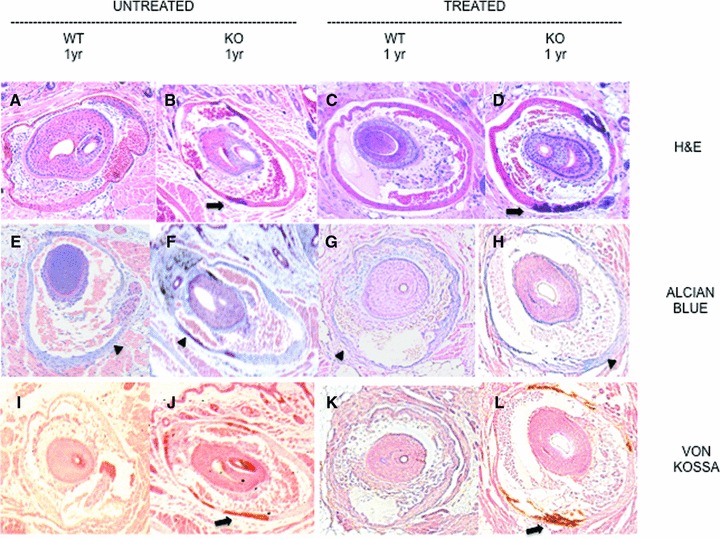
Figure 4.

Stained vibrissae in untreated versus treated mice. Frames (A) through (D): H&E stains. Frames (A) and (B) are untreated wild‐type and knockout mouse vibrissae capsules. Frames (C) and (D) show treated wild‐type and knockout vibrissae capsule sections. Arrows show mineralization of the connective tissue capsule surrounding the vibrissae. The second row shows staining of the vibrissae with alcian blue (pH 2.5). Frames (E) and (F) are from are from untreated wild‐type and knockout mouse sections. Frames (G) and (H) are treated wild‐type and knockout mouse sections. Arrowheads in the alcian blue row (E through H) show the total proteoglycan deposits in the connective tissue capsule surrounding the vibrissae. The last row (J through L) are vibrissae sections of untreated (wild‐type and knockout) followed by treated (wild‐type and knockout) mice stained with von Kossa. Arrows show mineralization of the connective tissue capsule surrounding the vibrissae. Mineralization of the connective tissue capsule surrounding the vibrissae can be best viewed in the knock out columns of untreated or treated groups in the H∓E and von Kossa rows.
