Fig. 4.
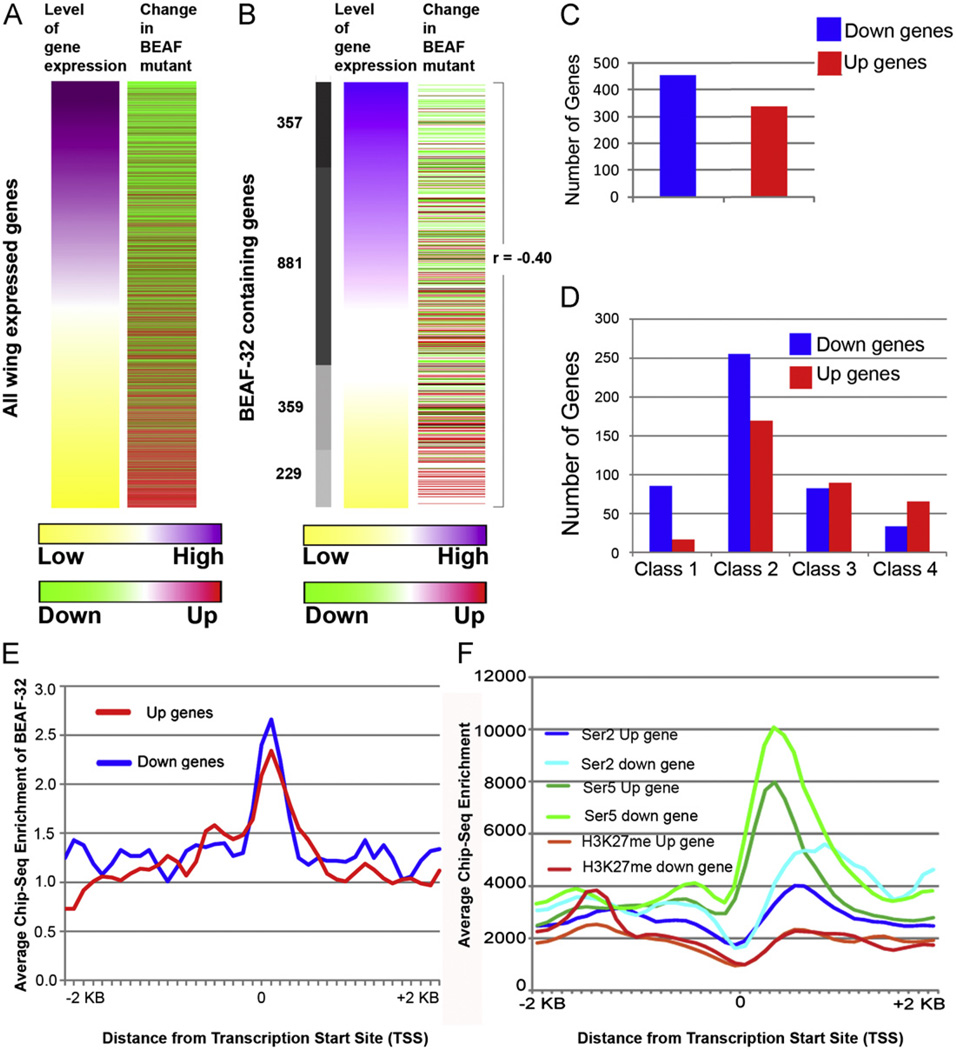
Genome-wide changes in BEAF-32 dependent transcription. (A) Heatmaps representing genome wide gene expression changes in wing imaginal tissue upon loss of BEAF-32. Levels of gene expression are ranked from high (purple) to low (yellow) according to wild type expression. The second column indicates changes seen in mutant cells, either up-regulated (towards red) or down-regulated (towards green). (B) BEAF-32 bound genes sorted based on levels of gene expression and their respective changes in mutant tissue. The Pearson correlation values are indicated to signify the changes in BEAF-32 mutant tissue. (C) Number of BEAF-32 bound genes showing transcription changes by a factor of more than 1.5-fold in the BEAF-32NP6377 mutant. (D) Number of BEAF-32 bound genes that are either up-regulated or down-regulated at different expression levels. (E) Distribution of BEAF-32 around the TSS of up- and down-regulated genes. (F) Genomic landscape of CTD-phosphorylated RNA polymerase II and histone H3 trimethylated at Lysine 27 in wild type wing tissue around up- and down-regulated genes. (For interpretation of the references to color in this figure legend, the reader is referred to the web version of this article.)

