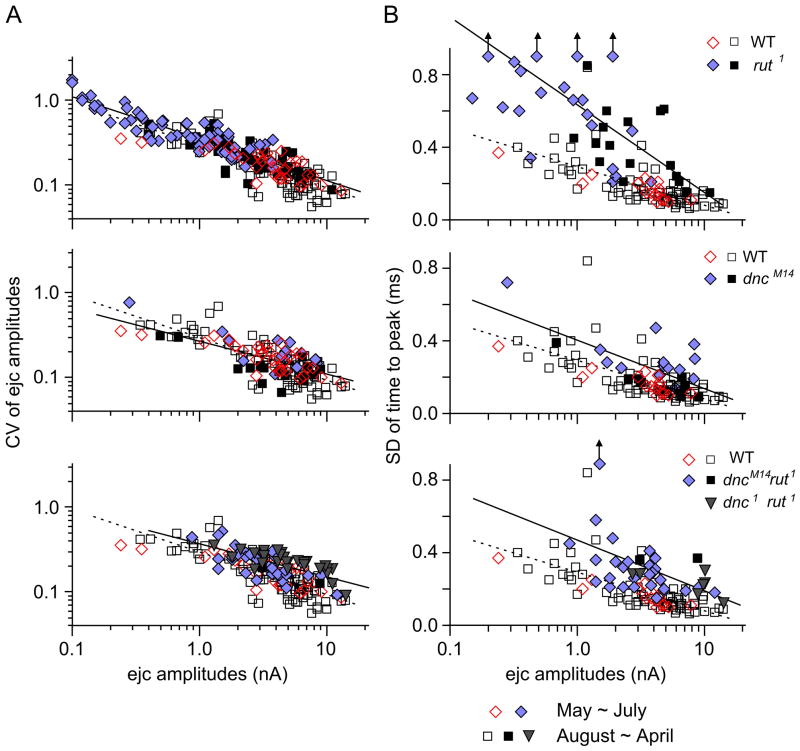
Figure 3.
Altered release properties in rut, dnc, and dnc rut. (A) CV of focal ejc size is displayed as a function of averaged ejc amplitude from individual recording sites. In each panel, rut, dnc, and dnc rut data are plotted against WT data. Note that the slope of the regression lines for both WT and mutants was about 1/2, as expected from the quantal nature of transmitter release (see text). Therefore the magnitude of amplitude fluctuation in Fig. 2 could be predicted by the amount of release in different genotypes. (B) SD of time to peak plotted against ejc amplitude. Variability in peaking time was larger in rut, dnc, and dnc rut compared to WT over the range of focal ejc sizes, indicating loose temporal regulation of vesicle release. The deviation from WT was greatest in rut, which was partially corrected in dnc rut double mutants. Regression lines for both WT (dotted) and mutants (solid) are shown in each panel for comparison. Different symbols indicate data from different periods of the year (See Fig. 4). Data points represents individual recording sites along different motor terminal branches. The number of branches in A and B is 82 and 63 (WT CS), 60 and 19 (rut1), 17 and 12 (dncM14), 19 and 17 (dncM14 rut1), and 12 and 5 (dnc1 rut1), respectively. The number of recording sites in A and B is 116 and 86 (WT CS), 105 and 38 (rut1), 31 and 25 (dncM14), 39 and 31 (dncM14 rut1), and 27 and 7 (dnc1 rut1), respectively.

