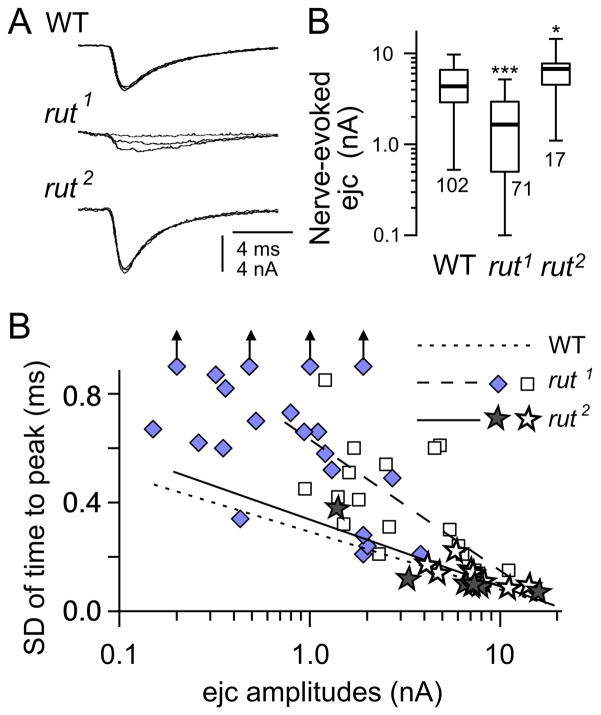
Figure 6.
Comparison of neurotransmission in rut1 and rut2. (A) Moderately increased in ejc amplitude in rut2 as opposed to severely depressed transmission in rut1. *** and * indicates p < 0.001 and 0.05, respectively (rank-test with Bonferroni correction for multiple comparison). (B) Severity of the defect in release timing was much less in rut2 compared to rut1. Regression lines are shown for WT, rut1, and rut2. Filled symbols: collected on May - July. Open symbols: collected on August - April. Data for rut2 were collected from 3/2000 to 6/2000. Data for rut1 are shown but WT data are omitted for clarity (cf. Fig. 3).

