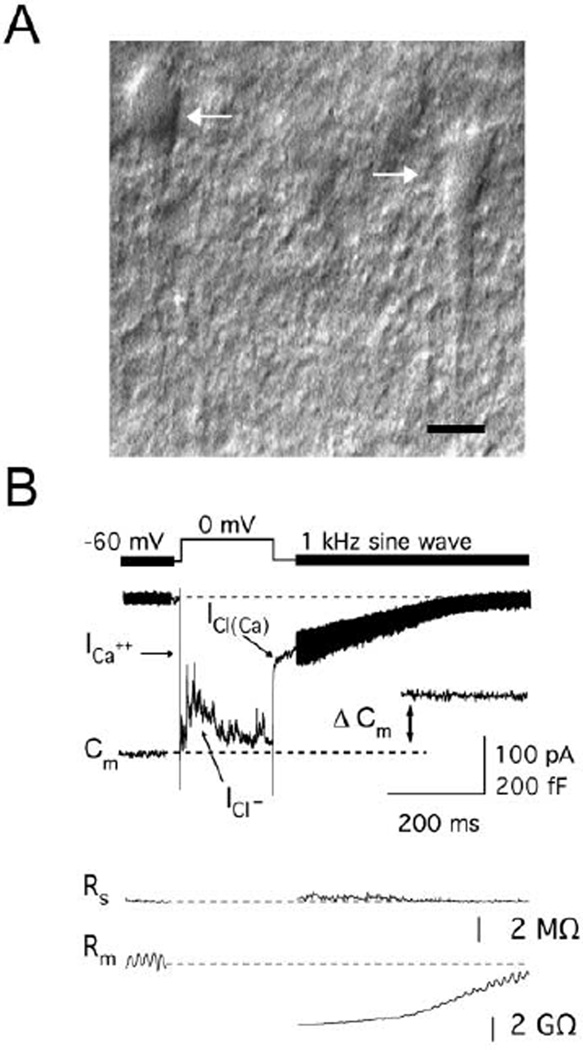
Figure 1. Typical Voltage-Clamp Recording and DIC Image from Bipolar Cell Terminals in a Retinal Slice.
(A) DIC image of Mb1 bipolar cell terminals (arrows) from a goldfish retinal slice (scale bar, 5 µm). These terminals reside in the inner plexiform layer close to the ganglion cells and send their axons to somata in the inner nuclear layer (axons run downwards from terminals).
(B) Voltage-clamp record of a calcium current (ICa) with superimposed outward GABAergic currents (ICl−, inward Cl− flux) at an isolated bipolar cell terminal. Membrane capacitance (Cm) was measured using a 1 kHz sine wave and reflects exocytosis (ΔCm) following calcium influx. The Ca2+-activated chloride tail current [ICl(Ca)] follows Ca2+ influx and is inward (reflecting Cl− efflux) at a holding potential of −60 mV. Series resistance (Rs) remains constant following a depolarization, and the change in membrane resistance (Rm) reflects the transient conductance associated with ICl(Ca). Note that Cm measurements do not correlate with Rs or Rm.

