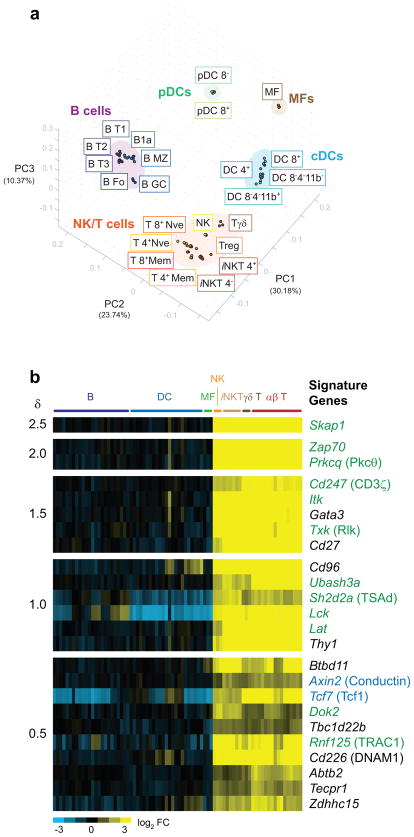
Figure 1. NK and T cells exhibit close relative similarity at the transcriptome level.
(a) Splenic leukocyte populations were separated into distinct groupings by PCA. The top three PC are displayed with their percentage contributions to inter-sample variation. Individual replicate samples are displayed. (b) Significant genes discriminating the NK/T complex from other leukocyte populations are displayed as a heat map in decreasing order of significance (δ score), with individual replicates shown. Green text = molecules in the ITAM signaling pathway; blue text = molecules in the Wnt/β-catenin pathway. Common names are in parenthesis. Populations abbreviations: B T1, B cells, transitional type 1; B T2, B cells, transitional type 2; B T3, B cells, transitional type 3; B Fo, B cells, follicular; B1a, B1a B cells; B MZ, B cells, marginal zone; B GC, B cells germinal center; pDC 8−, plasmacytoid dendritic cells, CD8−; pDC 8+, plasmacytoid dendritic cells, CD8+; MF, macrophages; DC 4+, dendritic cells, CD4+; DC 8+, dendritic cells, CD8+; DC 8−4−11b+, dendritic cells, CD8−CD4−CD11b+; DC 8− 4− 11b−, dendritic cells, CD8−CD4−CD11b−; NK, natural killer cells; Tγδ, TCRγδ T cells; Treg, T regulatory cells; iNKT 4+, invariant NKT CD4+ cells; iNKT 4−, invariant NKT CD4− cells; T 4+ Nve, CD4+ naïve cells; T 8+ Nve, CD8+ naïve cells; T 4+ Mem, CD4+ memory cells; T 8+ Mem, CD8+ memory cells.

