
Figure 3. Molecular uniqueness of resting NK cells.
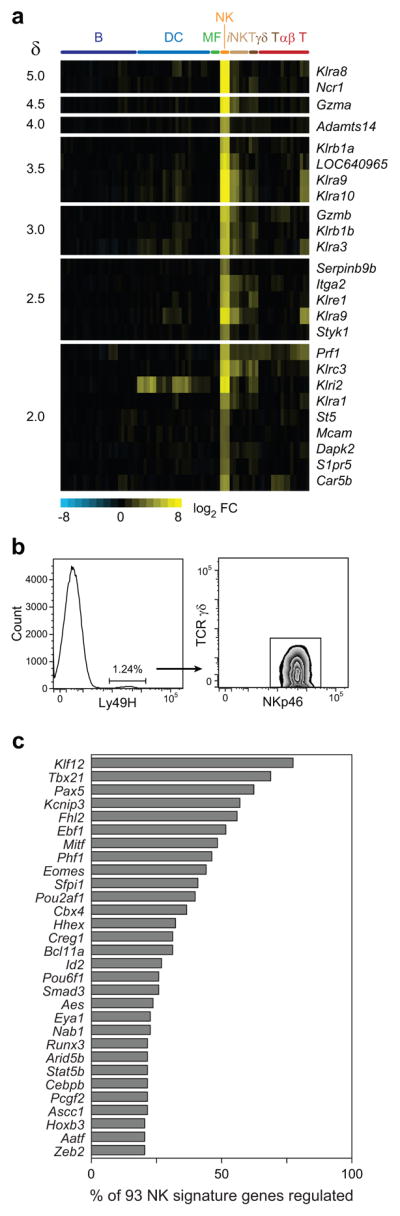
(a) Heat map of genes most strongly enriched in NK cells over all other populations, shown in decreasing order of significance. A full list of genes is available in Supplementary Table 1. (b) Flow cytometric analysis of Ly49H expression in splenic leukocytes. Cells staining positive for Ly49H co-express NKp46, but not TCRγδ. Data are representative of three independent experiments. (c) Predicted regulators of resting NK cell signature genes, in decreasing order of predicted influence on the NK signature genes shown in (a).