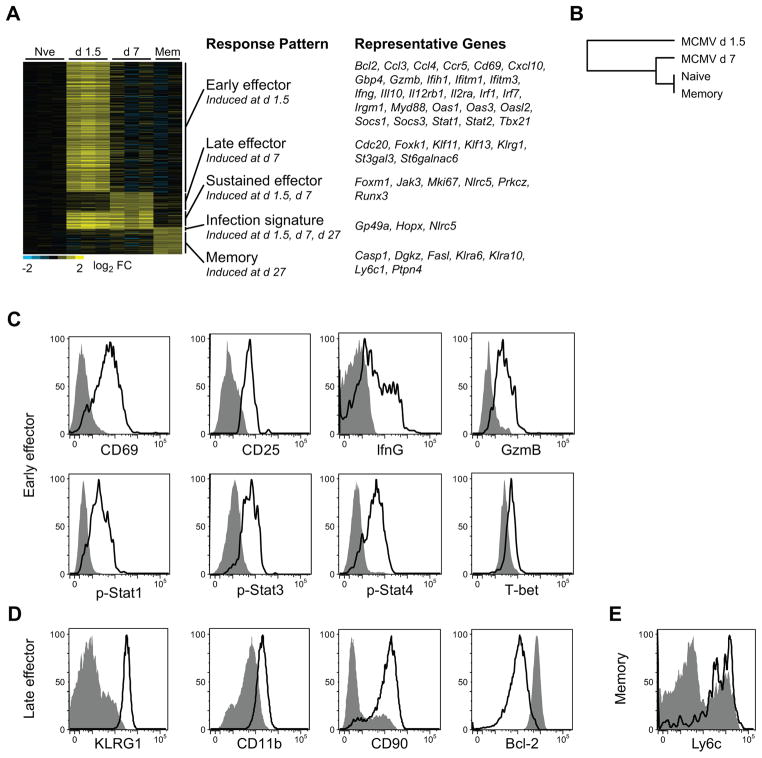
Figure 5. The Ly49H+ NK cell response to MCMV infection is dominated by an early activation response, followed by effector and memory responses.
(a) A heat map depicting all genes significantly induced at any time point post-infection relative to naïve Ly49H+ NK cells, grouped by hierarchical clustering. (b) The day 1.5 transcriptome of Ly49H+ NK cells responding to MCMV segregates from NK cells at other times during the response. Averaged populations were organized by hierarchical clustering based on Euclidean distance using all genes expressed at any time point. (c–e) Flow cytometric surface expression of CD69, CD25, and intracellular expression of IFNγ, GzmB, pStat-1, pStat-3, pStat-4, T-bet at day 1.5 PI (c), KLRG1, CD11b, CD90, and intracellular Bcl-2 at day 7 PI (d) and Ly6c at day 27 PI (e) is shown in Ly49H+ NK cells from MCMV-infected (black histogram) or uninfected mice (gray histogram). Data are representative of three independent experiments.

