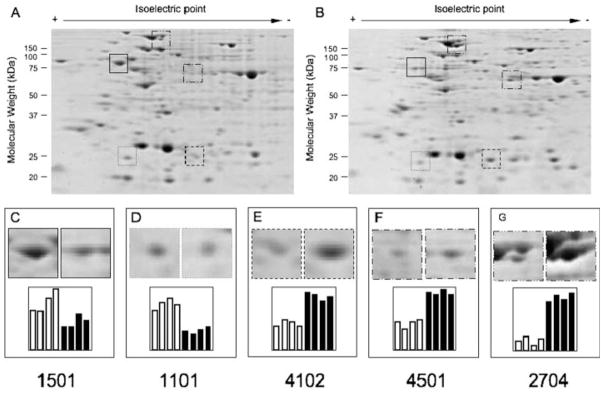
Figure 3.

Proteomic analysis of untreated (A) and G418-treated (B) K562-m5 cells. In panels C–G, examples are reported, relative to two downmodulated spots (panels C and D) and three upmodulated spots (panels E–G). The quantitative data of four independent proteomic analysis are shown in the bottom of panels C–G. To obtain these data, the 2DE gels were scanned by a GS-800 Calibrated Densitometer (Bio-Rad, Hercules, CA), using the Quantity One (1D Analysis Software), version 4.6.1
