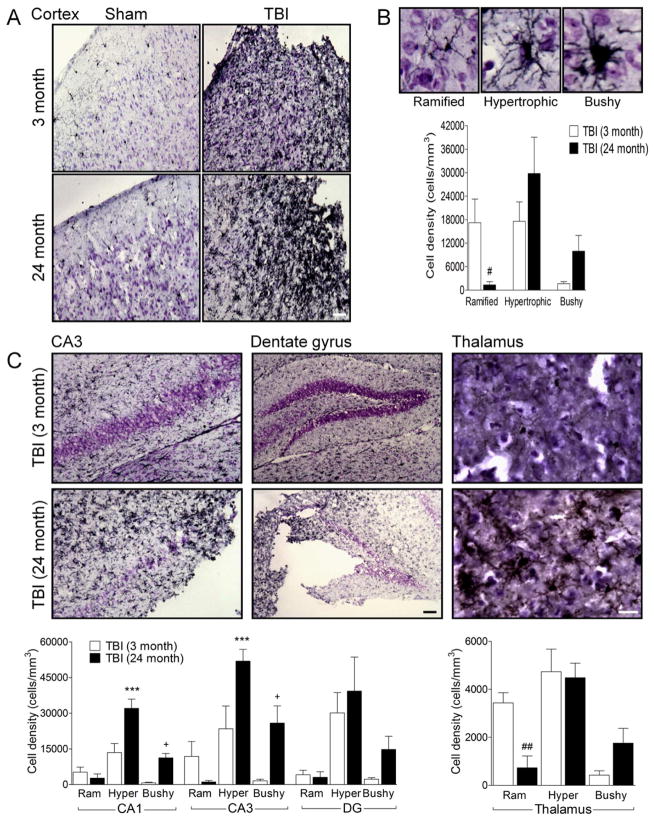
Figure 2. Aging increases the number of highly activated MG/MΦ (hypertrophic and bushy cellular phenotype) in the cortex, hippocampus and thalamus of TBI mice.
(A) Representative Iba-1 immunohistochemistry images of MG/MΦ activation in the cortex of young and aged TBI mice. Bar = 100μm. (B) Representative images of ramified, hypertrophic and bushy MG/MΦ activation phenotypes. There was a significant difference between MG/MΦ activation phenotypes in the cortex of young and aged TBI mice (F(2,18)=4.268, p=0.03), with significantly reduced number of ramified activation phenotypes (p<0.05), and trends to increased numbers of hypertrophic and bushy activation phenotypes in the aged TBI mice. (C) There were significant differences between MG/MΦ activation phenotypes in the hippocampus and thalamus of young and aged TBI mice (CA1 subregion (F(2.18)=7.489, p=004); CA3 subregion (F(2,18)=5.060, p=0.018); thalamus (F(2.18)=5.006, p=0.019)). There were increased numbers of hypertrophic and bushy MG/MΦ in the aged TBI mice in the CA1 and CA3 subregions (p<0.001 for hypertrophic, and p<0.05 for bushy), and significantly reduced numbers of ramified MG/MΦ (p<0.01) in the thalamus when compared to young TBI mice. Bars = 100μm (dentate gyrus) or 50μm (thalamus). Statistical analysis by two-way ANOVA (injury x activation phenotype), followed by post-hoc adjustments using Student-Newman-Keuls Multiple Comparison test. ***p<0.001, +p<0.05, ##p<0.01, where * = 3 month hypertrophic vs. 24 month hypertrophic, + = 3 month bushy vs. 24 month bushy, # = 3 month ramified vs. 24 month ramified. Bars represent mean ± s.e.m.

