Figure 5.
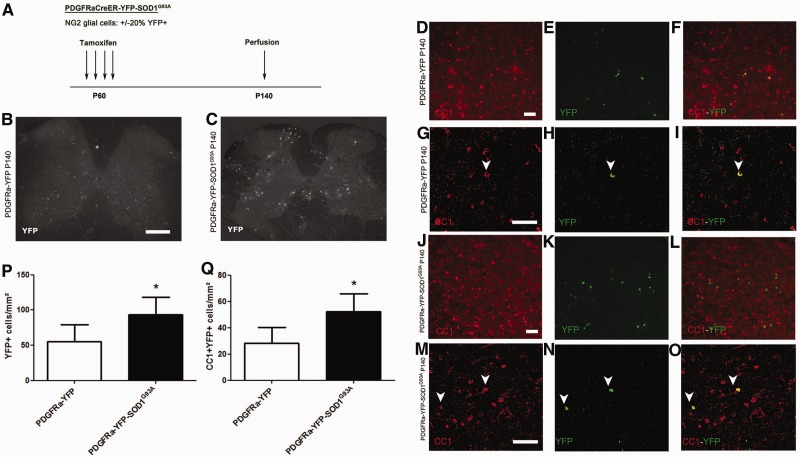
Fate mapping of NG2 glial cells in the spinal cord of SOD1G93A mice. (A) Labelling strategy used to label NG2 glial cells. PDGFRa-YFP-SOD1G93A and PDGFRa-YFP mice were injected with tamoxifen at the age of 60 days and YFP expression was evaluated at the age of 140 days. (B and C) In both PDGFRa-YFP (B) and PDGFR-YFP-SOD1G93A (C) mice at post-natal Day 140 (P140). YFP expression could be detected throughout the spinal cord. (D–O) YFP labelling could be detected in CC1+ oligodendrocytes in both PDGFRa-YFP mice (D–I) and PDGFRa-YFP-SOD1G93A mice (J–O). Enlarged confocal images are shown in G–I and M–O. Arrowheads denote double-labelled cells. (P) The total number of YFP-labelled progeny was significantly higher in PDGFRa-YFP-SOD1G93A mice than in PDGFRa-YFP mice (two-tailed unpaired t-test, n = 4–6, *P < 0.05). (Q) Similarly, in PDGFRa-YFP-SOD1G93A mice. The number of CC1 + YFP+ newly generated oligodendrocytes was significantly higher as compared with PDGFRa-YFP mice (two-tailed unpaired t-test, n = 4–6, *P < 0.05). Scale bars: D–O = 50 µm; B and C = 200 µm. Data represent mean ± SE.

