Figure 9.
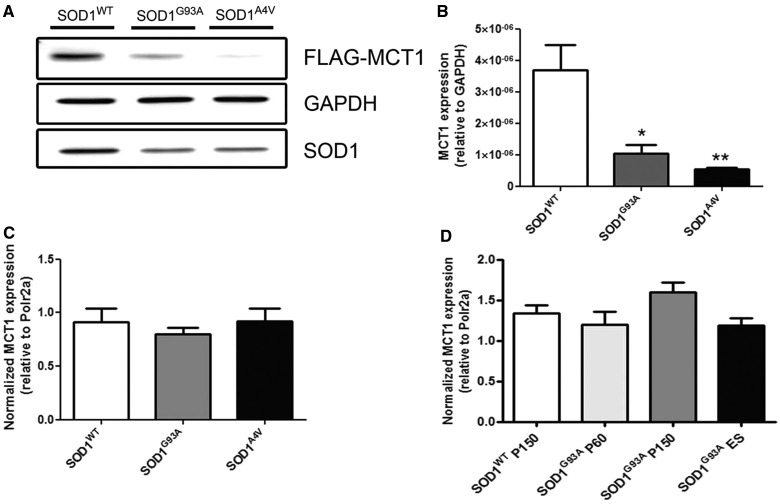
Western blot of human embryonic kidney cells 48 h after co-transfection with FLAG-tagged MCT1 and one of the different SOD1 species: SOD1WT, SOD1G93A and SOD1A4V. (A and B) Both SOD1G93A and SOD1A4V over-expression affected the expression of MCT1 compared with SOD1WT over-expression (one-way ANOVA, n = 3, *P < 0.05, **P < 0.01). (C) In contrast to the protein level, messenger RNA for MCT1 remained unaffected on transfection of the different SOD1 constructs (one-way ANOVA, n = 3). (D) MCT1 messenger RNA levels in SOD1G93A mice. There was no significant change in MCT1 RNA expression throughout disease progression as quantified by quantitative PCR (one-way ANOVA, n = 5–6 per group). Data represent mean ± SEM.

