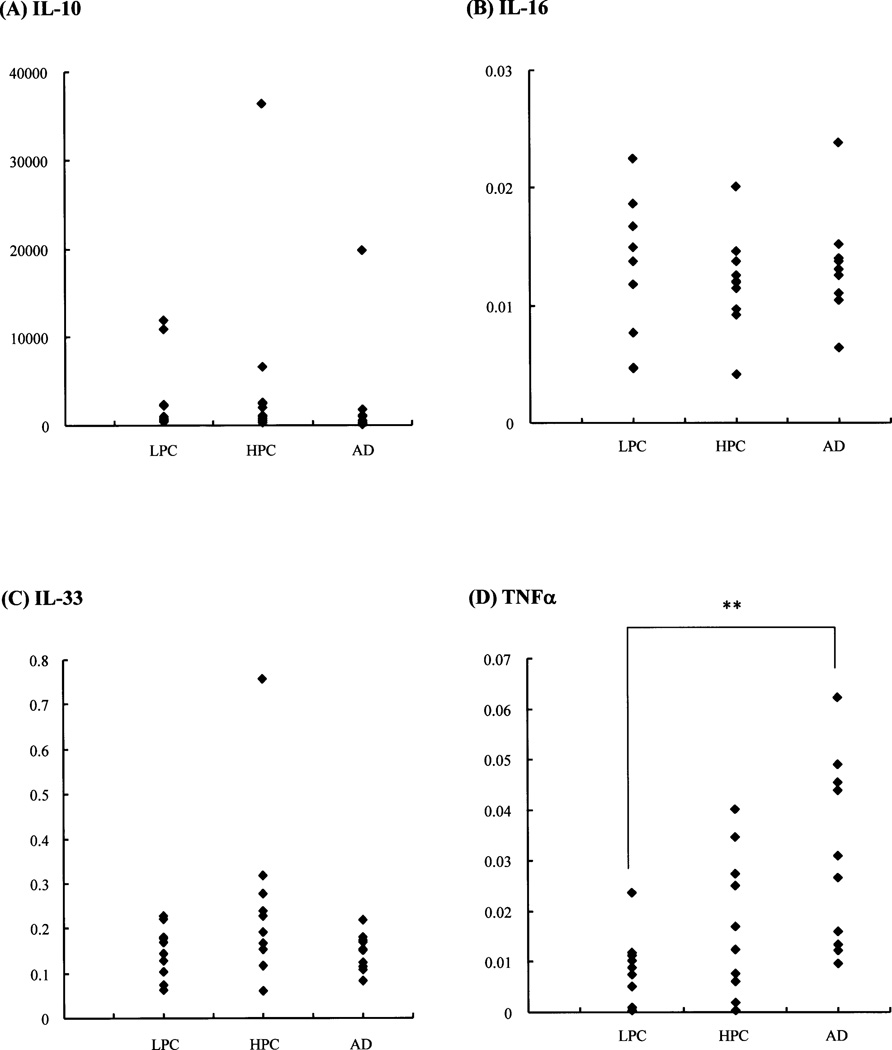
Fig. 3. Comparison of corrected Cp ratios of the target (cytokine)-to-reference gene (formula 1) in the cerebellum among LPC, HPC and AD patient groups.
Representative scattergrams of the corrected Cp ratios of IL-10 (A)-, IL-16 (B)-, IL-33 (C)-, and TNFa (D)-to-reference gene (PPIA) (formula 1) in the cerebellum show no significant alterations among the LPC, HPC and AD patient groups, except in TNFα (D) (p<0.05, Kruskal-Wallis test). The vertical axes represent the corrected Cp ratios. **, p<0.01 (Steel-Dwass test).

