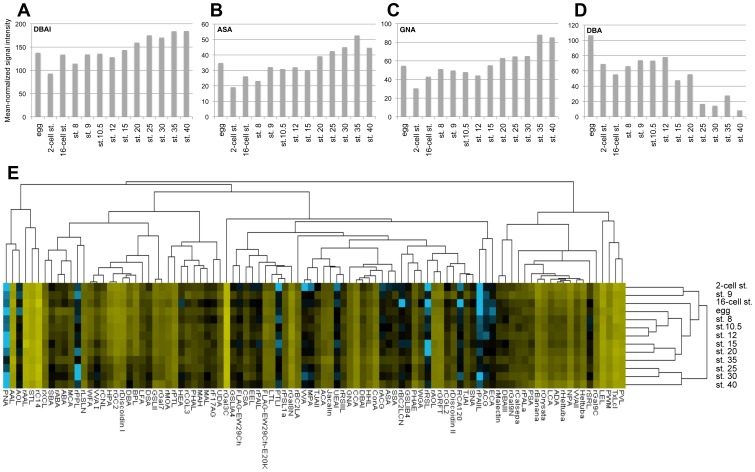
Figure 1. Lectin microarray data of Xenopus embryogenesis.
(A–D) Lectin microarray data for the 4 indicated lectins, DBAI (A), ASA (B), GNA (C), and DBA (D). Mean-normalized signal intensities of lectins are shown. All lectin data are shown in Table S3. (E) A summary of 96 lectin signals. Unsupervised hierarchical cluster was generated using mean-normalized and log-transformed signal intensities. Levels of lectin signaling are indicated by a color change from blue (low) to yellow (high). Egg, unfertilized egg; st., stage.

