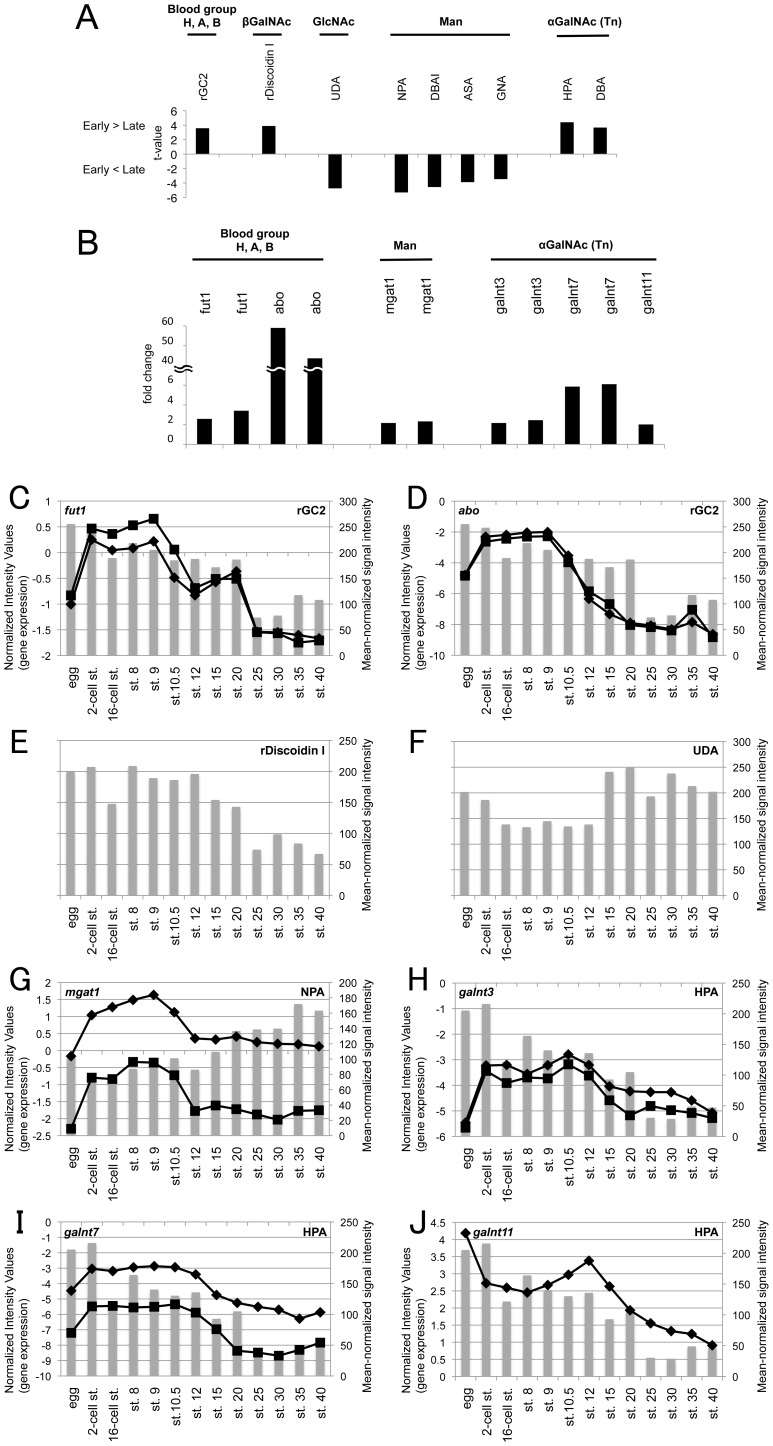
Figure 3. Alterations to glycan and glycogene expression during embryogenesis.
(A) Lectin microarray data were mean-normalized and analyzed by Student's t-test. Nine lectins with significantly different signals (p<0.01) between the early-stage group (2-cell stage, 16-cell stage, stage 8, and stage 9) and the late-stage group (stages 15–40) were categorized into 5 groups based on the glycan-binding specificities of lectins (indicated above). t-Values of lectins with higher signals in the early-stage group than in the late-stage group (indicated as Early>Late) are displayed as positive values, and t-values of lectins with lower signals in the early-stage group (indicated in Early<Late) are displayed as negative values. All lectin data are shown in Table S1. (B) Changes in the expression of glycogenes related to lectins with significantly different signals in early- and late-stage groups. Fold changes in 11 DNA microarray probes for glycogenes and glycans that may be regulated by these glycogenes are shown. All gene data are deposited in the GEO database as GSE40620. (C–J) Temporal changes in lectin signals and glycogene expression during embryogenesis. Normalized intensity values of glycogene probes are represented as lines in the primary Y-axis (left side). Mean-normalized signal intensities of lectins are represented as bars in the secondary Y-axis (right side). All lectin data are shown in Table S3. (C) fut1 and rGC2, (D) abo and rGC2, (E) rDiscoidin I, (F) UDA, (G) mgat1 and NPA, (H) galnt3 and HPA, (I) galnt7 and HPA, (J) galnt11 and HPA.

