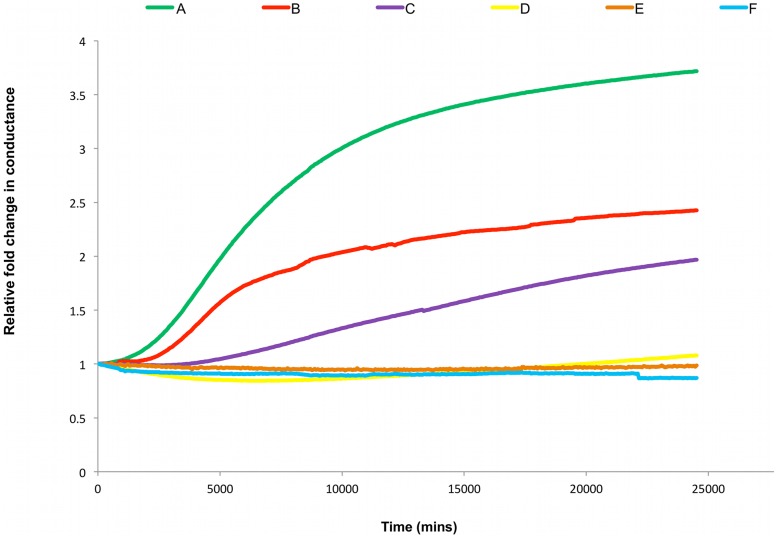
Figure 2. Membrane Conductance of Lysteriolsin.
Representative impedance spectroscopy recordings of (A-E) 2 µM Lysteriolysin and (F) buffer control, added to tethered membranes made from AM199 containing varying amounts of cholesterol (mol% chol) (A) 50, (B) 25, (C) 12.5, (D) 6.25, (E) 0, (F) 50; [n = 3].

