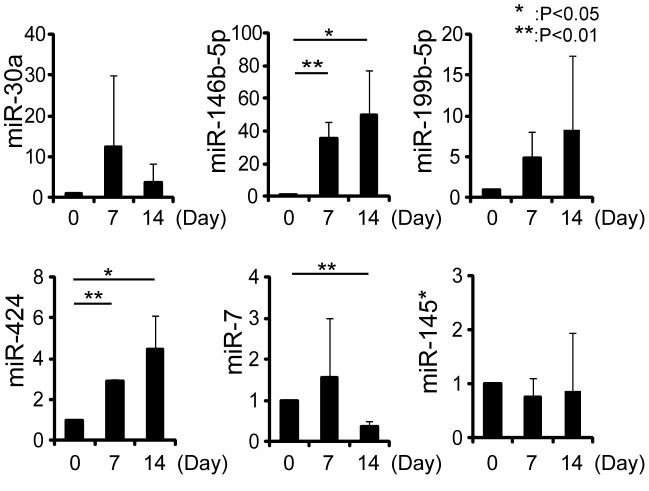
Figure 5. Changes in miRNA during osteogenic differentiation of PDGFRα+ cells.
At the different time points during osteogenic differentiation of PDGFRα+ cells, the expressions of miRNAs indicated were quantified by qRT-PCR. Values are represented as the ratio to uninduced cells and shown as means ± s.d. of three independent preparations.

