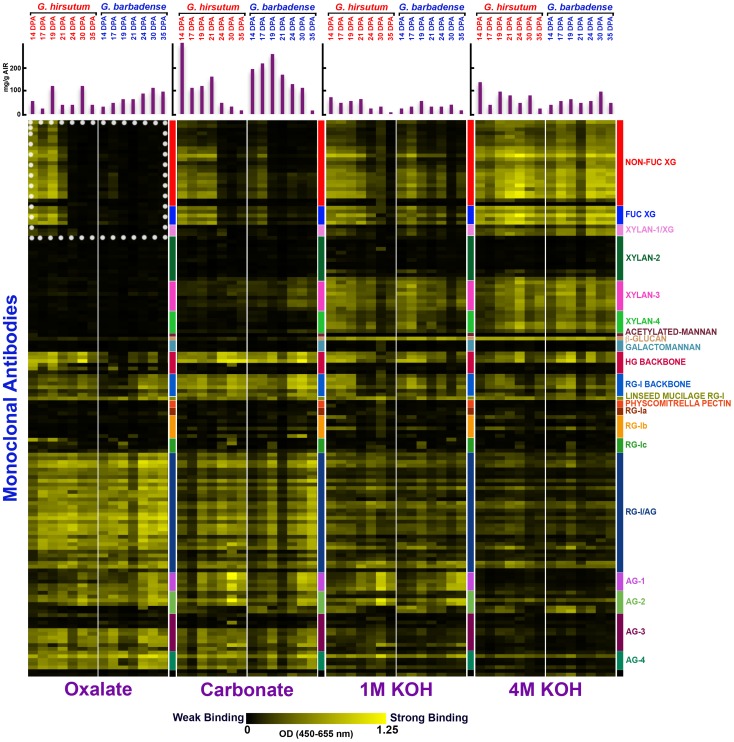
Figure 3. Glycome Profiling of sequential extracts prepared from multiple fiber samples representing major stages of cotton fiber development in G. hirsutum and G. barbadense.
A vertical color-coded strip shows the clades of cell wall glycan-binding antibodies (as defined in [21]). Each successive cell wall solvent is shown on the bottom, with a split panel above each label showing the results for Gh and Gb fiber at 14 to 35 DPA. Absorbance values >0.10 typically are perceived as non-black. The bar graphs show the amount of cell wall material removed by each solvent from each sample (mg extracted/g AIR). The dotted white box outlines binding of XG-directed antibodies to the oxalate extracts, where the most striking differences between the two species were observed.

