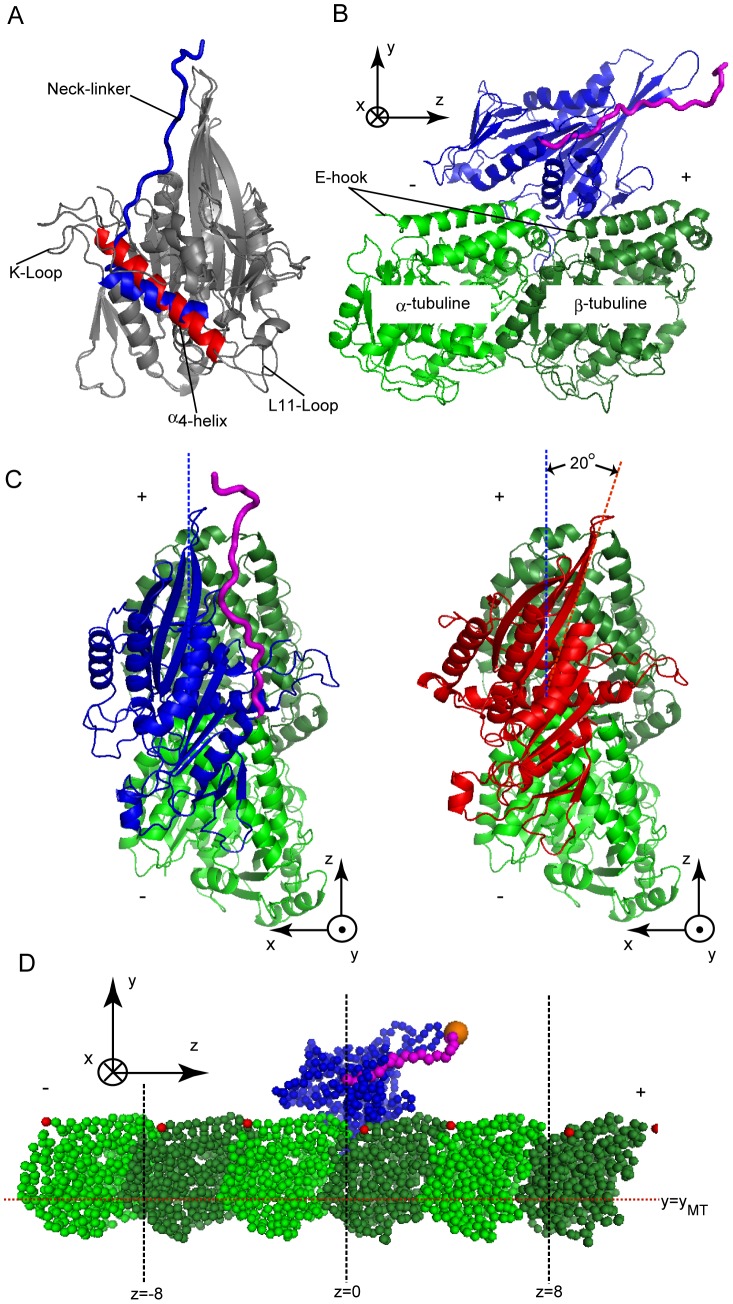
Figure 1. Structure of KIF1A and MT.
(A) Superposition for ATP-form and ADP-form structure of the monomer KIF1A. The parts that differ in the two forms are colored: α4-helix for ATP-form in blue and ADP-form in red. (B) The side view of KIF1A (blue and red)-MT (green) complex structure in the ATP-form. The neck-linker is in magenta. (C) The top view of KIF1A-MT complex structure in the ATP-form (left) and the ADP-form (right). (D) The initial structure of the CG simulations. The z-axis is aligned to the long axis direction of MT. The red dots in MT represent E-hooks positions.

