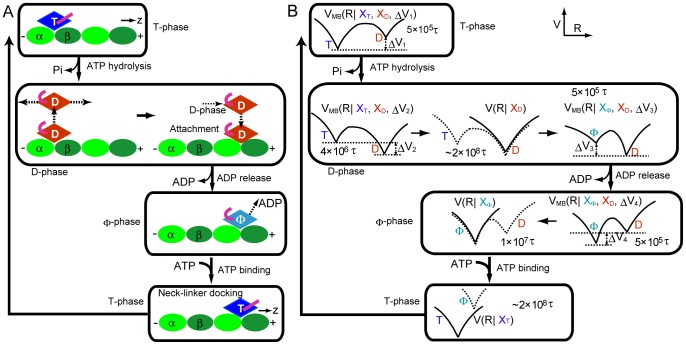
Figure 2. ATP-hydrolysis chemical cycle and CG simulation scheme.
(A) The representative model of the ATP hydrolysis cycle of KIF1A. The rhombus with string (magenta) indicates the KIF1A head with the neck-linker. The “T”, “D”, and “Φ” mean ATP-bound, ADP-bound, and nucleotide-free states, respectively. The bent (straight) string means the disordered (docked) neck-linker. The ellipsoids (light green and green) correspond to the αβ-tubulins that compose MT. The entire cycle is divided into 4-phases, T-phase (just before ATP hydrolysis), D-phase, Φ-phase, and T-phase (until neck-linker docking). (B) The CG simulation scheme. The V, R, and X indicate the potential, the temporal conformation, and the reference structure, respectively. The simulation consists of the combination of the two-basin V MB(R) and single-basin V(R) potentials. Each stage is simulated for the indicated time, where the unit of time τ in CG-simulation corresponds to τ∼0.128 ps.

