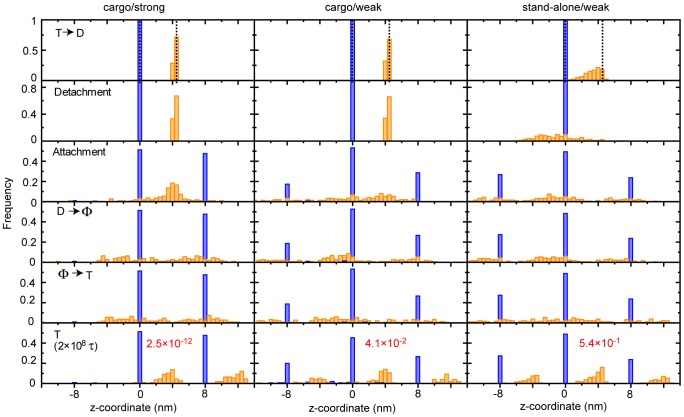
Figure 5. Position distribution of the KIF1A-head and C-terminus in one ATP-hydrolysis cycle.
The left, middle, and right panels show the position distributions of KIF1A-head (blue) and C-terminus (orange) for [cargo/strong], [cargo/weak], and [stand-alone/weak] cases, respectively. One ATP cycle was split into 6-phases. In the top panel, the vertical dashed lines show the initial positions (z ∼4.25 nm). In the bottom panel, the red-letter values indicate the P-values (see Table 1 for more detail).

