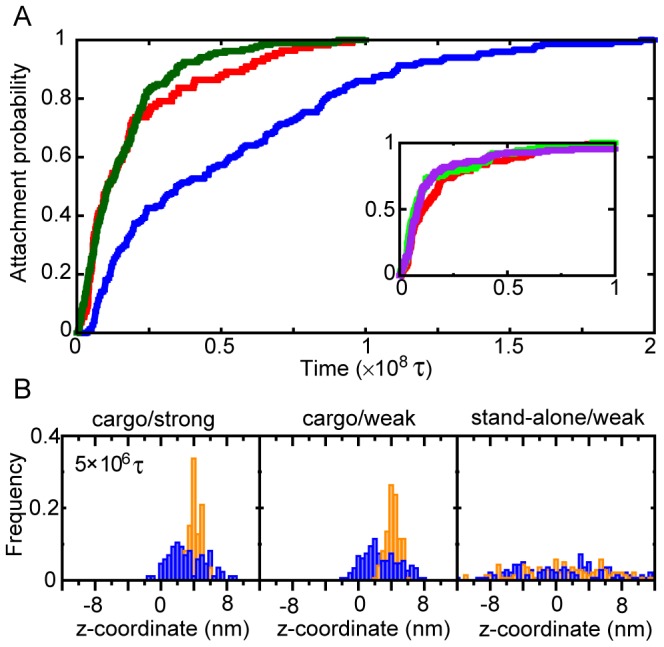
Figure 7. The attachment and the diffusion processes in D state.

(A) The attachment probabilities as a function of the duration time after the dissociation of the KIF1A head from MT for the cases of [cargo/strong] (red), [cargo/weak] (blue), and [stand-alone/weak] (green). The inset is the corresponding results of [cargo/strong] with the three sizes of cargoes (See Fig. 6 captions for the color assignments and the cargo-analog sizes) (B) The statistics of the head and the cargo-analog positions at 5×10⁶ τ after the dissociation of the head from MT in D-state. The left, middle, and right panels correspond to the case of [cargo/strong] [cargo/weak], and [stand-alone/weak]. The meanings of the blue and orange bar are the same as those in Fig. 5.
