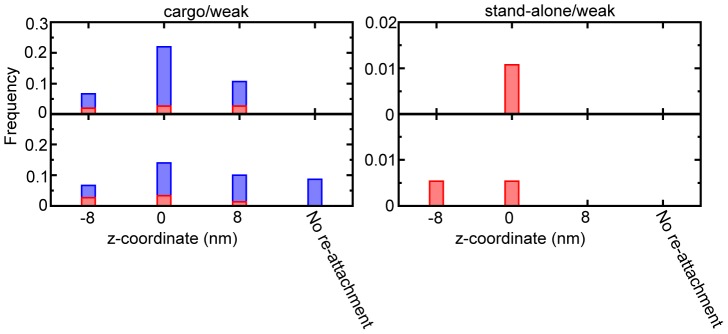
Figure 9. The statics of the re-dissociation and the reattachment process.

The upper panel shows the re-dissociation probability at each-binding site, while the lower one indicates the reattachment probability of the head. The left one and the right one are for the cases of [cargo/weak] and [stand-alone/weak], respectively. The state that caused the re-dissociation/reattachment event was shown by different colors; the red (D-state), and blue (T-state).
