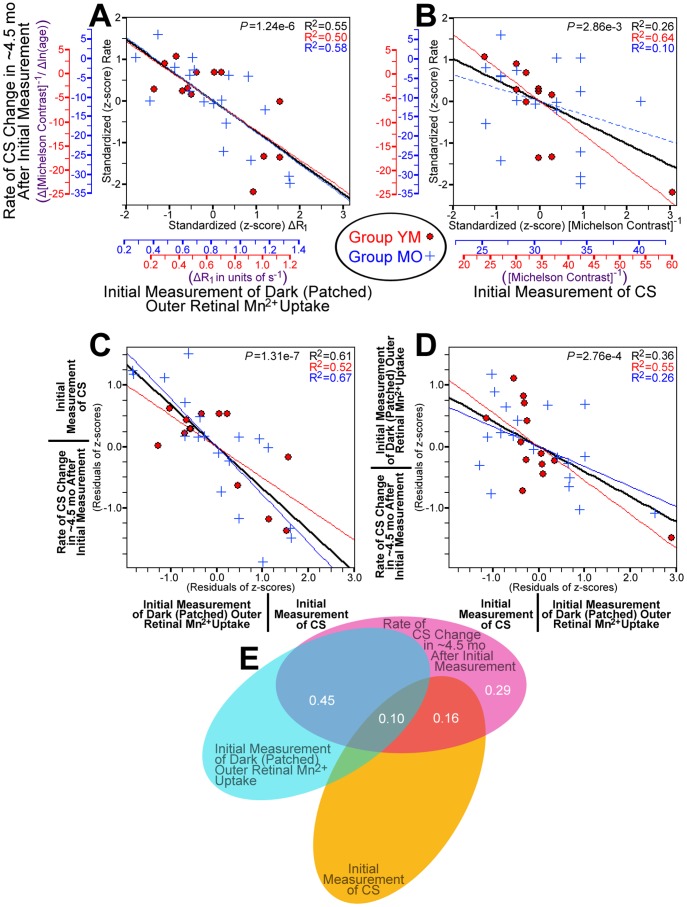
Figure 4. Prediction of CS declines by initial Mn2+ uptake and CS.
Initial CS and Mn2+ uptake measurements were made at age ∼2.5 mo in Group YM (red •) and age ∼7 mo in Group MO (blue +). A: Greater Mn2+ uptake in the dark-adapted outer retina predicts greater rates of CS decline in the following ∼4.5 mo. The red and blue axes show the pre-standardized values for Mn2+ uptake (ΔR1; x-axis) and rate of change in CS (change in inverse Michelson contrast divided by change in log-transformed age). B: Higher initial CS values predict greater rates of CS decline in the following ∼4.5 mo. C: When statistically controlling for initial CS – y-axis values in this plot are the residuals from the combined (standardized; black line) best-fit in B – greater Mn2+ uptake in the dark-adapted outer retina strongly predicts greater rates of CS declines in the following ∼4.5 mo. D: When statistically controlling for the effect of greater Mn2+ uptake in the dark-adapted outer retina, initial CS strongly predicts greater rates of CS decline in the following ∼4.5 mo. E: Venn diagram showing the proportion of variance in rate of CS decline that is uniquely explained by dark-adapted outer retinal Mn2+ uptake (semipartial correlation (‘sr2’) = 45%) or initial CS (‘sr2’ = 16%), of the total ∼71% of variance explained by some combination of those two variables. The relationship between outer retinal Mn2+ uptake and CS declines beyond the ∼4.5 mo period is shown in Supplemental Figure S4 (in File S1). Regression analyses using other MRI measurements (e.g. eye morphology) are provided in Supplemental Tables S1–S4 in File S1.

