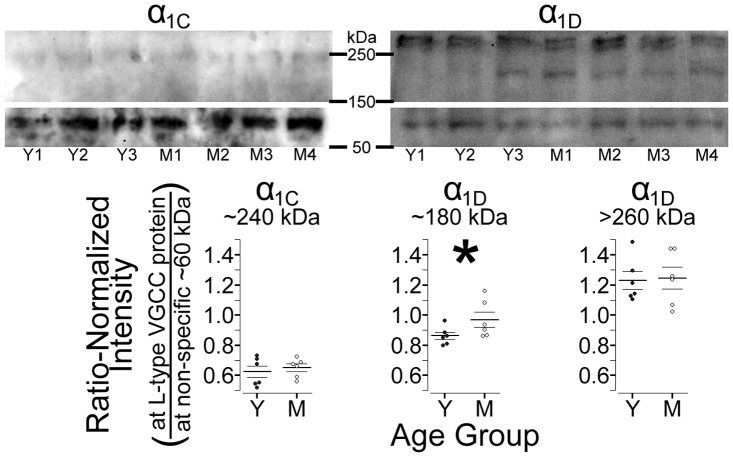
Figure 6. Western blots of retinal L-VGCC expression in young and mid-adult rats.
Top: Representative anti-α1C (left) and anti-α1D (right) gels with lanes loaded with protein from 3 (of 6) young-adults (Y1–Y3) and 4 (of 6) mid-adults (M1–M4). For display purposes, images were cropped to highlight bands from of L-type channels at >150 kDa and the non-specific band used for normalization at ∼60 kDa. The brightness and contrast settings differ for anti-α1C (meant to display the band at ∼240 kDa) versus anti-α1D, but are the same for the high and low molecular weight portions of each gel. Bottom: Consistent with expectations, only expression of the ∼180 kDa α1D isoform is higher in mid- than young adults (*P<0.05).

