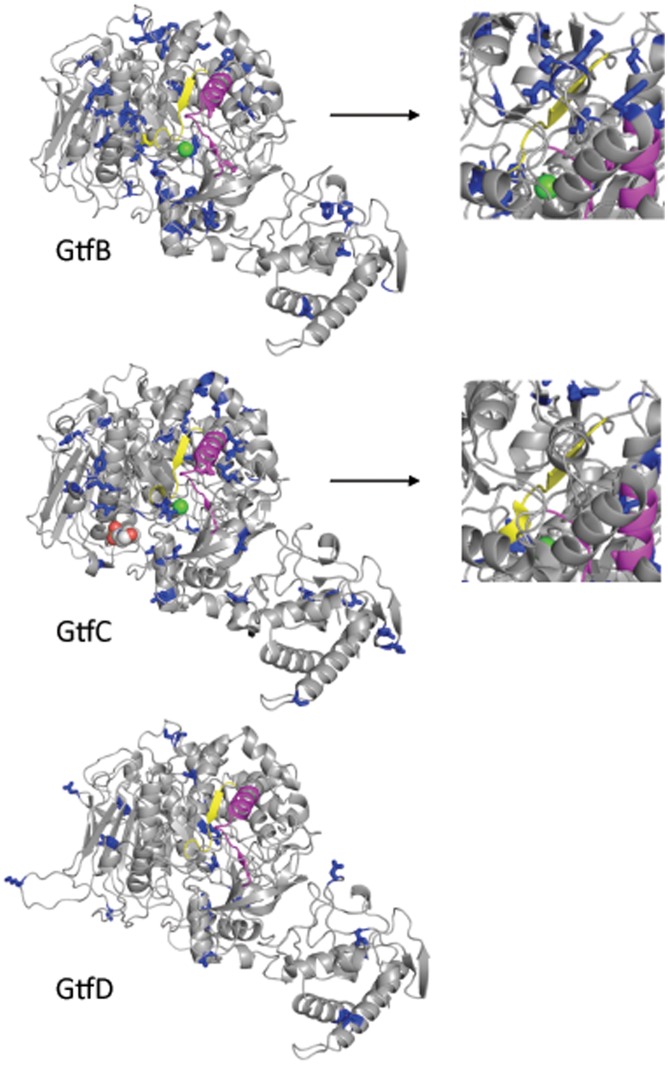
Figure 2. Models of the 3D structure of the catalytic domain of S. mutans Gtfs.
Blue: amino acids under negative selection (side chains shown). Yellow: active site. Magenta: Gtf-P1 region [69]. Green sphere: Ca2+ ion. Right panels: Detail of a different view of the region surrounding the active site of GtfB and GtfC.

