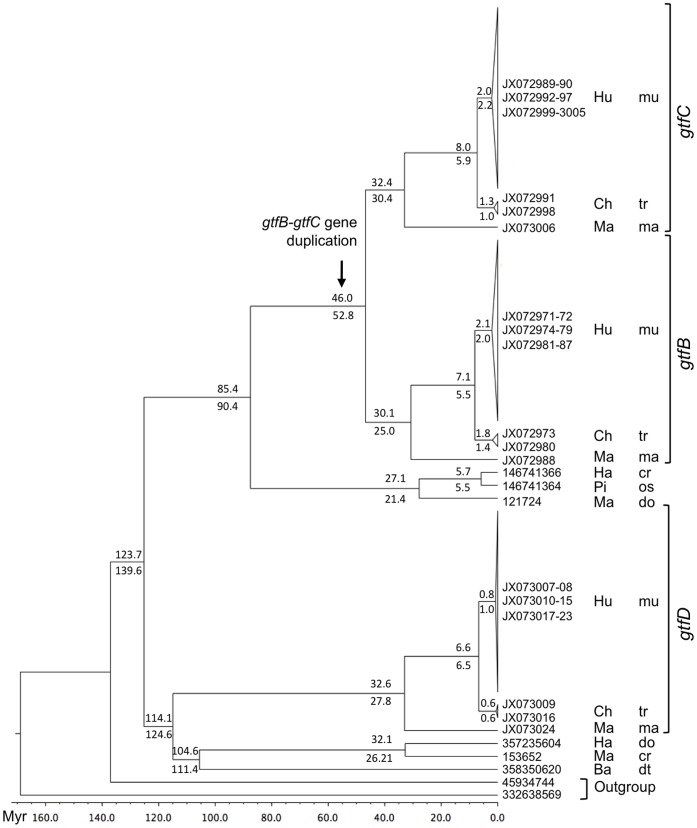
Figure 3. Bayesian phylogeny of streptococcal Gtfs.
Values represent mean node ages obtained from either the nucleotide (top) or the amino acid (bottom) sequences, with the node calibration from [31]. The substitution models were TN93+Γ+I and WAG+Γ+I for nucleotide and amino acid data, respectively. The scale at the bottom represents time before present in millions of years. Bacterial species are indicated as follows: cr = S. criceti; dt = S. dentirousetti; do = S. downei; ma = S. macacae; mu = S. mutans; os = S. orisuis; tr = S. troglodytae. Strains isolated from Hu = human; Ch = chimpanzee; Ma = macaque; Ha = hamster; Pi = pig; Ba = bat.

