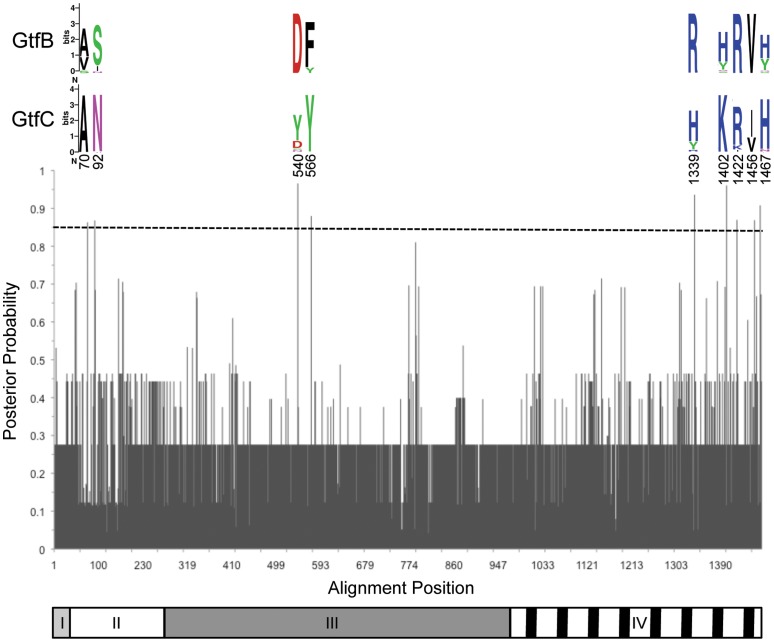
Figure 4. Site specific profile of type I functional divergence posterior probability.
Logos are shown for positions predicted to be critical for type I functional divergence between GtfB and GtfC (cutoff P>0.85). Residues are color coded by biochemical property and heights represent their relative frequency at each site. The Gtf protein domains are represented below the graph. I) signal peptide, II) N-terminal variable region, III) catalytic domain, IV) glucan binding domain.

