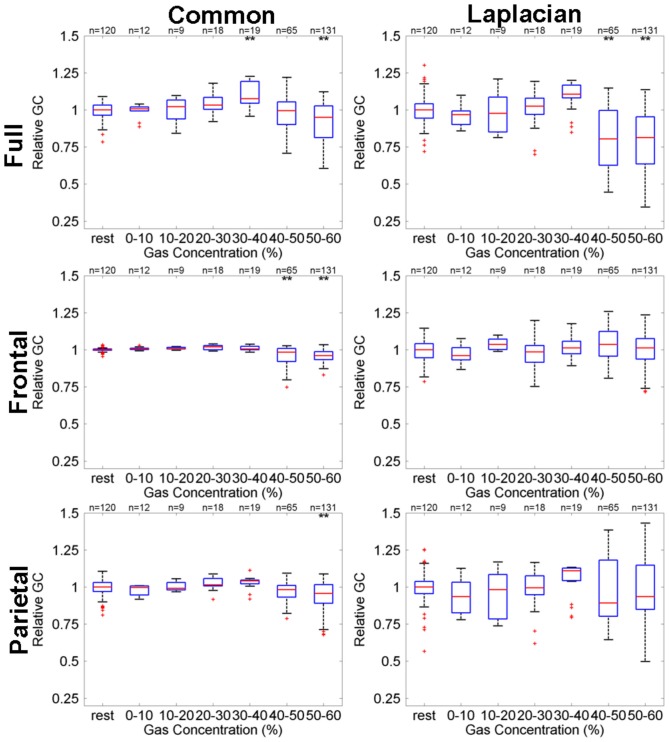
Figure 6. Dependence, for the 60% peak gas group, of GC-based functional connectivity ( ) at 11 Hz defined relative to the median during rest on N2O gas concentration for full brain (top row), frontal (middle row) and parietal (bottom row) networks, obtained either with common-reference (left column) or Laplacian re-referencing (right column).
Box-whisker and multi-comparison test significance marker ( ,
,  ) details are the same as for Figure 5.

