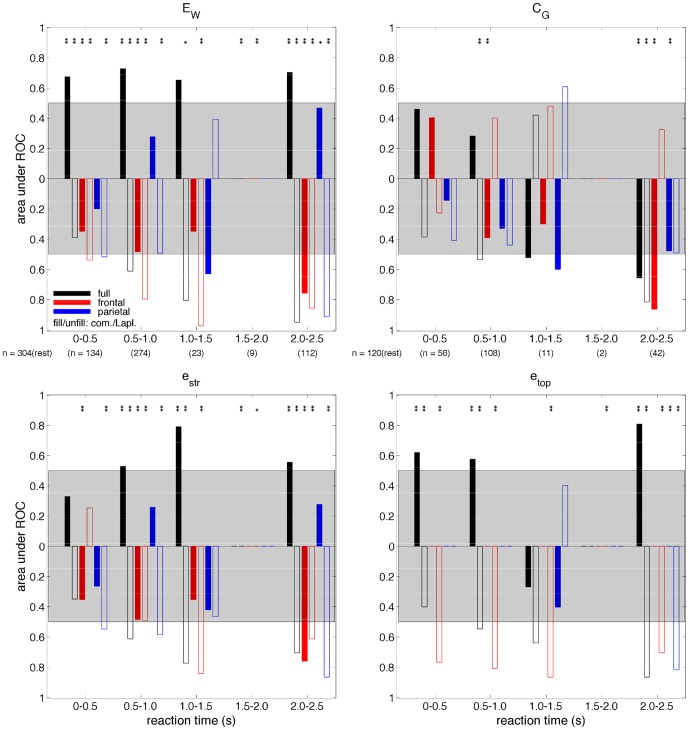
Figure 9. AUROC as a function of aCPT reaction time for the 60% peak gas group for (top left) weighted global efficiency,  , (top right) global coherence,
  , at 11 Hz, (bottom left) the contribution of connection strength to global efficiency,
  , and (bottom right) the contribution of connection topology to global efficiency,
  .
.
One-way ANOVAs were typically significant across rest and the five reaction time bins for each of the measures ( for the GE measures except for frontal
  with common-reference derivation,
  for the GC measure). The difference in the median measure value relative to rest is indicated by the the direction of the respective bar (up, increase; down, decrease). Multi-comparison test significance marker (
 ,
,  ) details are the same as for Figure 5. The remaining features are the same as described in Figure 7.

