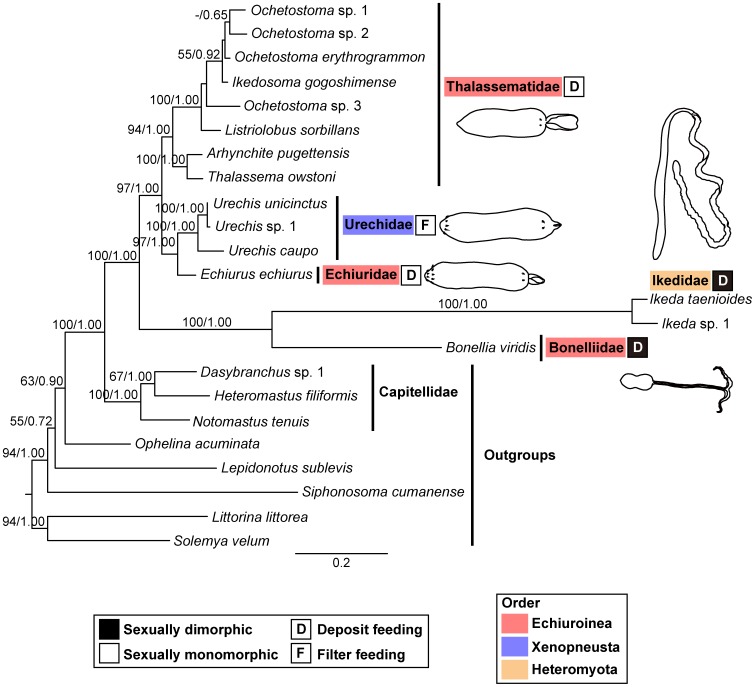
Figure 2. Maximum-likelihood tree of echiuran worms based on the combined dataset of 18S, 28S, H3 and COI genes.
Numbers above branches indicate maximum-likelihood bootstrap support values followed by Bayesian posterior probabilities. The colors of the boxes to the right of the family names indicate whether the family is sexually dimorphic (black) or monomorphic (white). The capital letters in the boxes indicate the feeding mode of the family, i.e., deposit feeding (D) or filter feeding (F). The colors shading the family names indicate the order to which the family belongs, as defined by Ruppert et al. (2004) [3].

