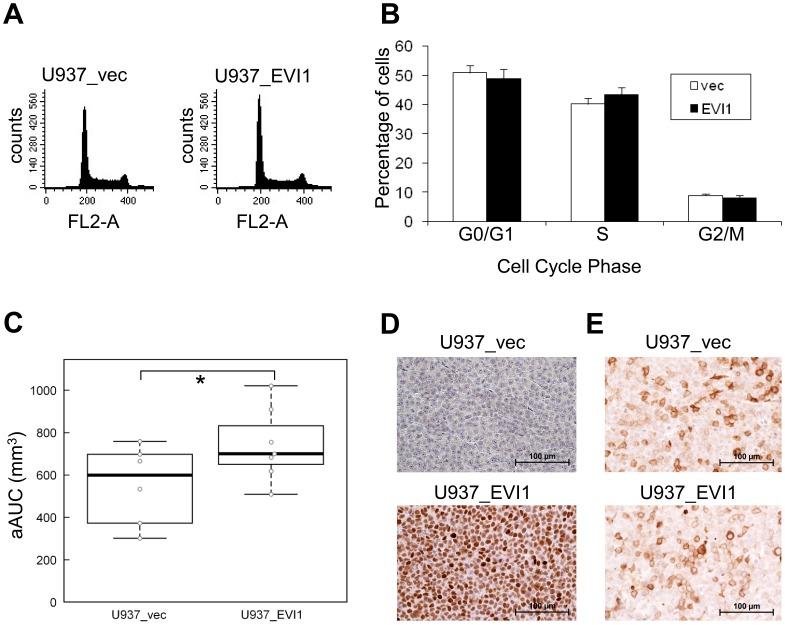
Figure 2. Effects of EVI1 on growth dynamics in vitro and in vivo.
A) Examples of cell cycle profiles of U937_vec and U937_EVI1 cells. B) Cell cycle distribution of U937_vec and U937_EVI1 cells. Shown are the means+standard errors of the mean (SEM) from 3 independent experiments. None of the differences between the two cell lines are statistically significant (Student’s t-test). C) Tumor growth after subcutaneous injection of U937_vec and U937_EVI1 cells into the flanks of CB-17 scid/scid mice. The adjusted area under the curve (aAUC) was calculated for each tumor, and the two groups of tumors were compared by nonparametric bootstrap inference. *, p<0.05. D) Immunohistochemical (IHC) staining showing persistent expression of EVI1 in U937_EVI1 derived tumor xenografts. E) IHC revealing the presence of similar proportions of CD11b positive cells in U937_EVI1 and U937_vec derived tumors.

