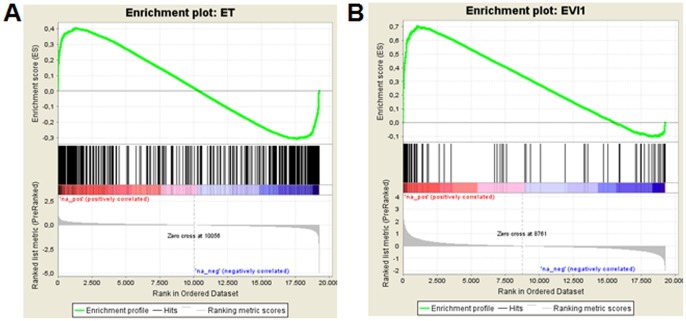
Figure 6. EVI1 and etoposide regulate overlapping sets of genes.
cRNAs from two independent cultures of U937_vec and U937_EVI1 cells treated or not treated with 400 nM etoposide for 48 h were hybridized onto Affymetrix ST1.1 arrays. Only genes deregulated at least 2-fold in both experiments were considered as differentially expressed. Gene set enrichment analysis (GSEA) [68] was performed to evaluate concordant differences of A) etoposide regulated genes within the gene expression list ranked by average log2-fold changes between U937_EVI1 and U937_vec cells, and B) EVI1 regulated genes within the gene expression list ranked by average log2-fold changes between etoposide treated and untreated U937_vec cells. The normalized enrichment scores were 1.9 in A) and 2.2 in B); the p-values and the q-values of the false discovery rate were 0.0 in both analyses.

