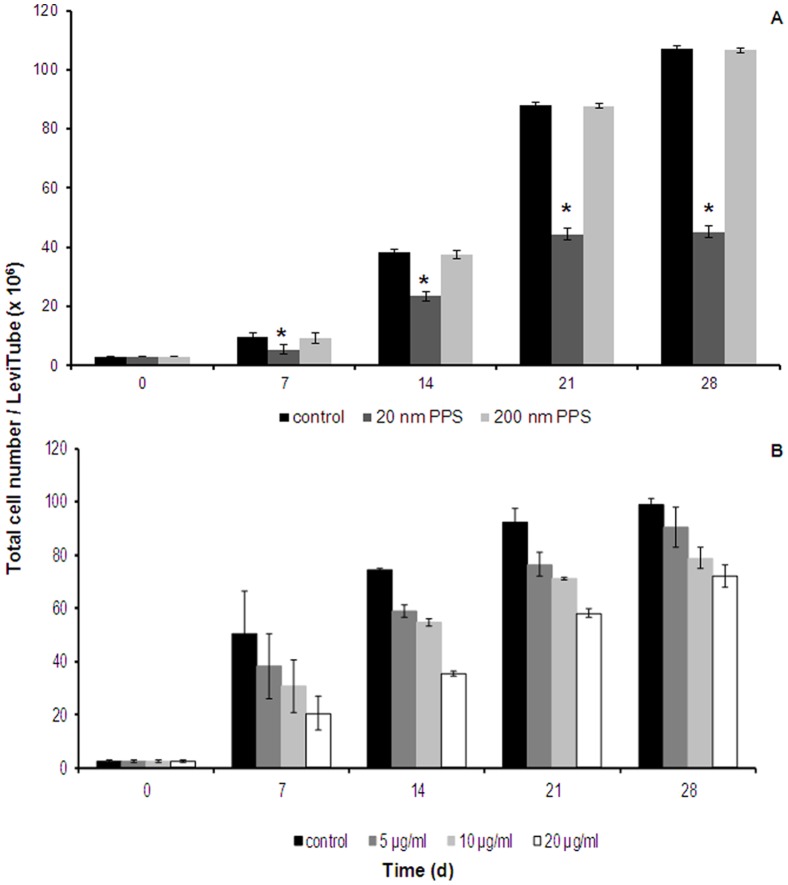
Figure 5. Long-term cytotoxic effects of NPs on EAhy 926.
Cultures were exposed to PPS over a period of 28 days, Data are presented as mean ± SD of the total cell number; n = 5, p-value <0.05. * indicates statistically significant changes in cell numbers between control and treated cells at each time-point. Long-term effects upon exposure to different concentrations of MWCNT >50 nm are shown in (B). Data are presented as mean ± SD of the total cell number per culture vessel; n = 3. (d), days.

