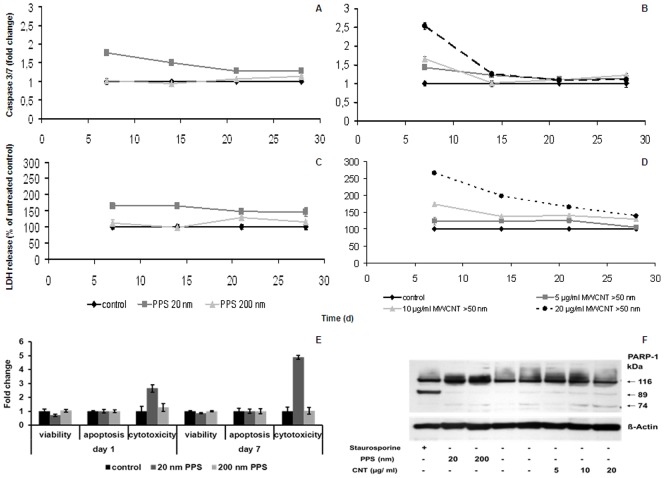
Figure 6. Mode of action of different NPs in microcarrier cultures.
Induction of apoptosis (A and B) and necrosis (C and D) after long-term exposure of EAhy 926 grown on GEM™ to NPs. Data are presented as mean ± SD, normalized to the total cell numbers per culture vessel; (d), days. Changes in viability, caspase activation, and cytotoxicity in cells exposed to PPS at early time-points are presented in (E). Data are presented as mean ± SD. Western blot detecting PARP-1 after treatment of microcarrier cultures with both, PPS and CNTs at an early time-point (day 7) is presented in (F). Treatment with 1 µg/ml staurosporine was used as a control for apoptosis induction.

