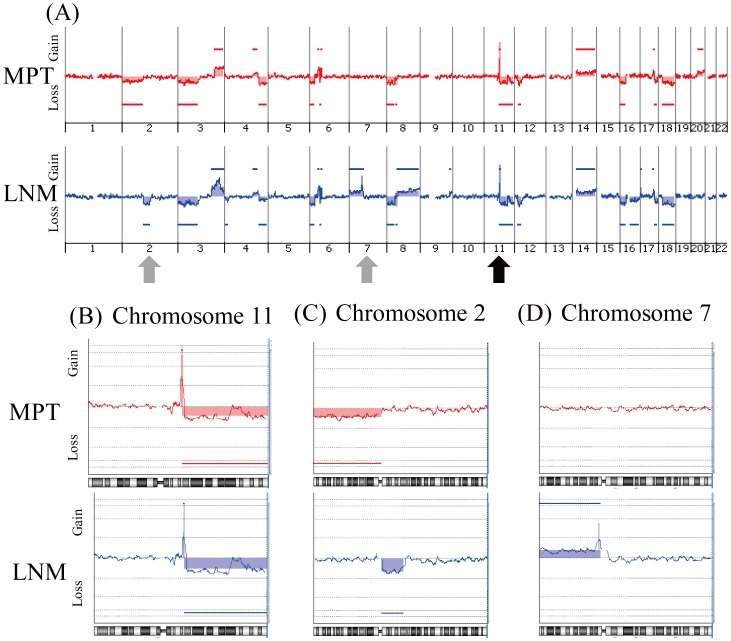
Figure 2. Representative genomic profile of a MPT and the corresponding paired LNM of a metastatic OSCC.
Whole genomic profiles of the paired samples of MPT (above) and LNM (below) from case 8 are shown in (A). Detailed genomic profiles of Chr11 indicated by a black arrow in (A), and Chr2 and Chr7 indicated by gray arrows in (A) are shown in (B), (C) and (D), respectively. Horizontal lines above the center represent regions of gain, and those below the center represent regions of loss. Both MPT and LNM show similar genomic patterns in chromosome 11q (B). However, loss of 2p is detected only in the MPT (C), and loss of 2q and gain of 7p are detected only in the LNM (C and D).

